
Knowledge Hub
Ecommerce Metrics: The Numbers That Matter (And Why Yours Do Not Match The Averages)
By John Butterworth · August 17, 2026
A store owner asked me last month why their conversion rate had dropped since spring. Of all the ecommerce metrics a UK store watches, that one causes the most needless panic, and in this case nothing had dropped at all.
Their consent banner had changed and their denominator had grown. The rate on screen was measuring a different population of visitors than in March.
Before you rebuild anything, check whether those two numbers are even the same fraction. Very often they are not, and nobody says so.
I am John Butterworth, founder of Mint SEO in Manchester. Eleven years of UK Shopify audits have taught me to check the measurement before I check the store.
Below are the seven ecommerce metrics worth watching, each with its arithmetic and a UK figure to judge it against.
Then the three reasons your own readings sit apart from those figures: how Shopify counts, what the law changed in February, and what Shopify withdrew in May.
The Numbers Worth Watching, And What Good Looks Like For A UK Store
A Metric Is A Number That Changes A Decision
Every store I audit has a dashboard. Very few owners can tell me which number would make them change what they do next week.
That gap separates a metric from a report. Apply one test before adding anything to a screen you check daily.
If no value of a number would change your behaviour, file it monthly and leave it there. The seven ecommerce metrics below survive that test for most stores.
Conversion Rate
Orders divided by sessions, multiplied by a hundred. Take 240 orders against 12,000 sessions and the conversion rate is two per cent. Note which denominator you just used, because that choice is where most of the confusion in this article begins and it decides which benchmark you are allowed to compare against.
IRP Commerce reports that the average conversion rate in the eCommerce market increased by 9.66% from 1.85% to 2.03% in June 2026 compared to June 2025. Its benchmarks come from live trading data on its own platform, and they cover the UK and Irish market.
Figures of three and four per cent are global blends weighted heavily towards the United States, and vertical matters more than market does anyway.
Eightx puts food and beverage at 6.22%, beauty at 4.94%, fashion at 3.06% and home and furniture at 1.41%. Those splits come from an ecommerce CFO practice that publishes UK numbers by vertical. A furniture store at that level sits ahead of its category while looking like a disaster against the headline.
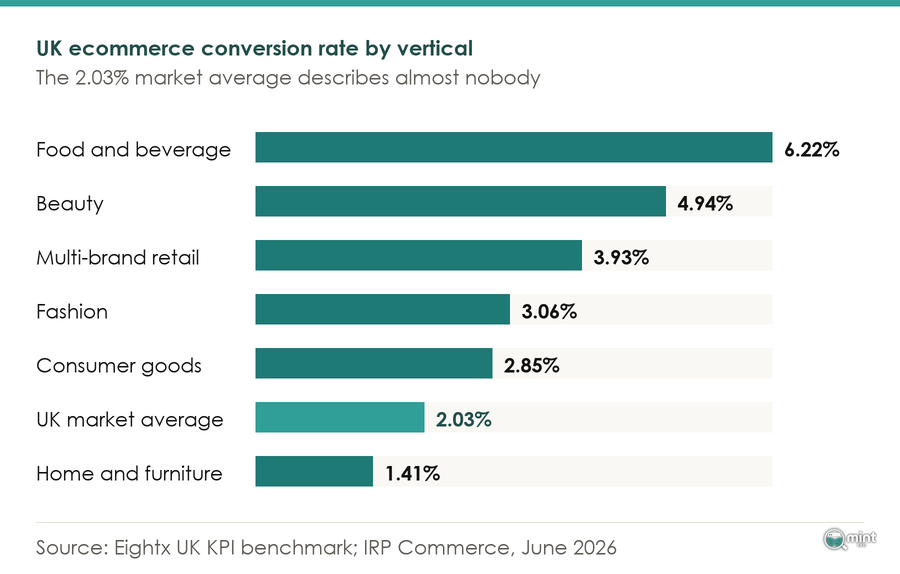
Vertical is not the only split hiding inside that headline, because device matters almost as much. Behaviour Digital finds that the average UK mobile conversion rate has stalled at just 1.8% in 2026, compared to a 3.9% desktop average. If your traffic is mostly mobile, your blended rate is a mobile rate wearing a disguise.
Which average gets quoted matters too. Behaviour Digital finds Great Britain's average e-commerce conversion rate stands at 3.4% as of April 2026, while the median site achieves 2.35%. A full percentage point separates those two readings.
So split by device, then by vertical, then compare. If a gap survives both splits, look at the site itself, and our guide to improving ecommerce conversion rate is the next stop.
Average Order Value
Total revenue divided by number of orders. Divide forty-two thousand pounds across 340 orders and the AOV is a little over a hundred and twenty.
IRP Commerce puts UK average order values at £127.06 in June 2026, up 2.32% year on year. A separate UK AOV benchmark from Eightx is the more useful read, because it breaks that single figure apart by vertical.
Eightx's benchmark puts jewellery north of £200 and fashion at around £112, with beauty or supplements lower again at £70 to £80. Price point and basket size are set by what a category sells. An all-industry mean averaging jewellery with supplements describes neither of them, and gives a store nothing to aim at.
AOV answers to merchandising. Bundles, spend thresholds and post-purchase offers all move it, while more traffic on its own leaves it flat.
Cart Abandonment Rate
Expect a high number here, because everybody has one. The arithmetic is carts created minus orders completed, divided by carts created.
Baymard Institute reports a 2026 cart abandonment rate of 70.22%, drawn from 50 studies covering more than 4,000 sites. Mobile sits at 85.65% and desktop at 73.07%. Its figure is a rolling meta-analysis of published studies. The field quotes it for that reason.
Reading that as a scorecard wastes a week, so use the separate Baymard dataset that codes the reasons instead.
Baymard's dataset finds extra costs such as shipping and tax are the top actionable cause at 39% of shoppers. Baymard's figures also record mandatory account creation driving 19% of abandonments, and a long or complicated checkout driving 18%.
Underneath those fixable causes, one further figure reframes the whole metric. Baymard's data records that 42% of US online shoppers have abandoned a cart because they were still at the browsing stage. That share belongs in a different column from the causes above it.
Work the fixable share and set the headline figure aside. Shipping cost visible early, guest checkout available, fewer steps. Our ecommerce CRO audit guide covers the sequence.
Customer Acquisition Cost
Total acquisition spend divided by new customers. Spend eight thousand pounds to win 210 new customers and CAC is a little over thirty-eight pounds.
On its own that figure decides nothing, and it becomes a decision only once you attach a payback period. Identical CAC is comfortable or fatal depending on how fast a customer repays it, because what constrains a store is cash coming back.
Compiling DTC benchmarks, Talk Shop reports the target CAC payback period is under 90 days for DTC brands. Payback beyond 6 months creates cash flow pressure that limits reinvestment capacity. That test scales with your own margin and order value, which no absolute CAC figure does.
Work out payback before you cut spend. A rising CAC with a shortening payback is usually a business getting better at selling.
Customer Lifetime Value
This is the one most stores calculate wrongly, by leaving margin out of it. Take average order value times purchase frequency times expected lifespan, then multiply by gross margin if you want a figure you can spend against.
You will be told to aim for an LTV to CAC ratio of 3:1, and that number came from software. Finsi reports DTC ecommerce sits at a median 2.3 LTV:CAC ratio, because gross margins of 40 to 60 percent cap LTV regardless of repeat purchase rate.
Category splits from the same publisher show why one target cannot cover everyone. Health and wellness brands typically see LTV:CAC ratios of 3:1 to 6:1 thanks to strong repeat purchase behaviour. Food and beverage brands often run 2:1 to 4:1 because high CAC relative to AOV compresses the ratio.
Retention explains why the software benchmark does not travel across. Because ecommerce buying is non-contractual, retention decays on a much steeper curve.
Luca models that decay directly, and the curve matters more here than any single reading on it. Its analysis finds ecommerce repeat-purchase rates collapse faster, to 52% by month 3 and 28% by month 12, where B2B software retains 90% or better annually.
A subscription renews unless somebody cancels it. A shopper has to decide to come back every single time. Lift a retention target from software and it will always read as failure on a store.
A store at 2.3 sits at the DTC median. Judge yours against your category, and if you want the ratio to move, work on repeat purchase before first-order value.
Return Rate
Units returned divided by units shipped. Read it against your own category or not at all.
Eightx puts the 2026 average ecommerce return rate at 19 to 20.5%, against roughly 8.7% in physical retail. Online returns therefore run at more than double the rate of a shop floor. A shopper standing in a store has already handled the thing before paying for it.
Category pulls that average apart, and Eightx splits it accordingly. Eightx's benchmark puts apparel at 20 to 40%, electronics at 8 to 15% and beauty at 4 to 12%. Fit uncertainty is doing most of that work. Bracketing makes it worse, because a shopper who orders three sizes has decided in advance to send two of them back.
A separate UK return benchmark from Eightx is the one worth sitting with. That benchmark puts UK clothing at 23.6% and fashion overall at 28%, rising to 36% for items bought through social commerce. Whichever channel acquired an order predicts whether it comes back.
Fit and expectation drive most of it. Better sizing guidance and honest photography come before anything clever.
Net Promoter Score
I will be straight about this one. Of the seven, its value least often changes a decision for a store this size, and it is the only one here I would argue about.
The arithmetic is a single survey question: percentage of promoters minus percentage of detractors.
It aggregates what people say they will do, and behaviour can be measured directly.
A merchant on the Shopify Community forum, posting as shipperhq-dave, argued for tracking on-time delivery instead. Late shipments cost you the customer whatever a survey says.
Find the operational number underneath it and watch that.
Every figure above sits in one place here. Hold your own figures against the right column of it.
Your Shopify Conversion Rate Is Not The Conversion Rate In The Benchmark
Whether your figure can be compared to anything at all comes down to two published decisions Shopify made on your behalf. What goes in the denominator, and which of two same-named reports you happen to be reading.
Shopify Counts A Conversion Per Session, Not Per Order
Shopify uses the formula (Total Orders / Total Sessions) x 100, using sessions rather than unique visitors. One person visiting three times contributes three to the bottom of that fraction and at most one to the top.
Benchmark tables are usually built on visitors, so the admin figure sits below the table figure for the same store. Your repeat-visit rate sets the size of that gap.
Sessions also end on a clock, and Shopify's documentation states that a session ends after 30 minutes of no activity, and at midnight UTC.
That second cut catches people out. British Summer Time puts midnight UTC at one in the morning locally, so a late browse that carries past it is filed as two sessions and your denominator quietly gains a visit that never happened.
Neither view is wrong, and a visitor-based conversion rate tells you how many people eventually purchased.
A session-based conversion rate tells you how well each visit performed. Use the session view for conversion rate work, because the visit is the unit you are about to change.
Your numerator behaves oddly too. Shopify documents that a customer might make multiple separate purchases in a single session, which results in multiple orders being recorded, but it is counted as only one conversion.
Orders and conversions disagreeing inside one admin is designed behaviour.
Two Conversion Reports In One Shopify Admin, Two Different Rates
One retired report counted first-time buyers only, at visitor level, on a 30-day lookback. The report that replaced it counts every session that produced any order, repeat buyers included. Quote either and you are right; quote them in the same sentence and you contradict yourself.
Stores with strong repeat custom see the widest gap between the two, because repeat buyers are exactly what one report excluded and the other counts every time.
Two reports carry the same name and land several points apart. Where historic reporting does not line up with today, check which report produced the old figure before hunting for a cause.
The Check I Run Before I Believe A Conversion Rate
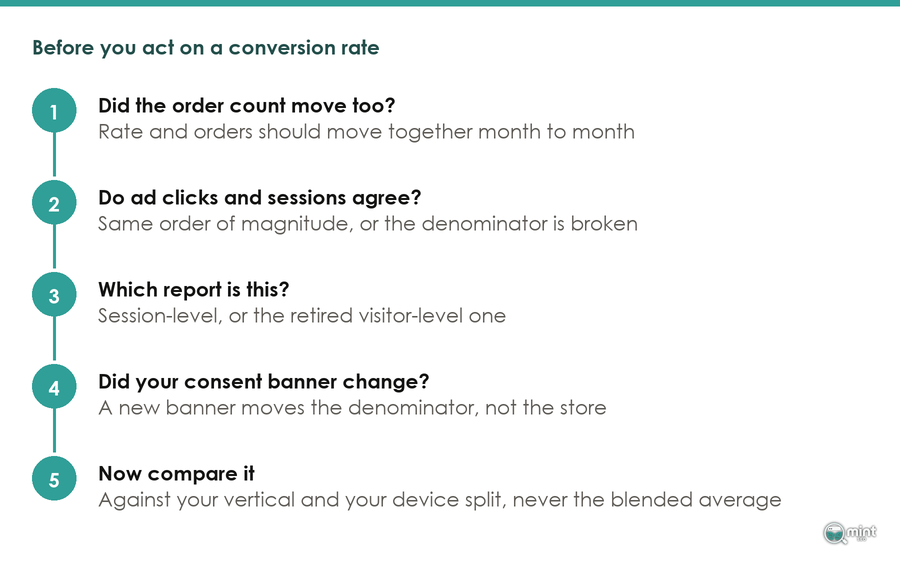
In the Shopify audits we run, I start one step before the conversion rate, on the relationship between two numbers. Did the rate and the order count move together, month to month?
Where they did not, tracking broke before the store did. A duplicated or missing tag changes one side of the fraction and leaves the other alone. The giveaway is that broken relationship, and it shows up long before any value looks odd.
One merchant on the Shopify Community forum, posting as ecom9, hit the extreme version. Meta was recording clicks more than 20x higher than the sessions Shopify recorded, against reported conversion rates of 30 to 40%. A rate that good is arithmetic failing, and the fault is almost always underneath the line rather than above it.
Even a healthy store shows a gap here, so calibrate before you panic. Shopify uses a last click attribution model and attributed to where the conversion happened, while each ad platform counts on windows of its own.
The most common measurement fault I find on a UK Shopify store is a GA4 property counting purchases twice, because the thank-you page fires the event and the pixel fires it again.
Where GA4 reads materially higher than the admin, start there.
This article stops at instrumentation, deliberately. Fixing a fault is its own job.
We have written that job up separately in our guide to ecommerce conversion tracking. It covers purchase events, deduplication and tracing a single order end to end.
What Moved Your Conversion Rate And Traffic In 2026 Without You Touching The Store
One came from Westminster in February and one from Shopify in May. Neither had anything to do with your store, and both leave a visible step in your own charts.
The Conversion Benchmark Shopify Used To Show You Has Gone
Shopify's changelog entry of 7th May 2026, titled Benchmark Comparisons In Analytics Will Be Removed On May 19th, confirms that Benchmark Comparison data in Shopify Analytics will no longer show new data, and the feature will be fully removed on May 19, 2026. Your in-admin answer to whether a conversion rate is any good stopped existing on 19th May.
Metric Targets and Sidekick are what Shopify points you to instead. Both describe your own store back to you, which answers a question you were not asking.
A target you set yourself cannot tell you that your whole category had a bad quarter. The withdrawn toggle did exactly that.
Replacing it means going outside the admin for a vertical figure, which is what the table above is for.
Your Session Count Changed When UK Consent Law Did
This one is a legal change, and easy to miss for that reason. Section 112 and Schedule 12 of the Data (Use and Access) Act 2025 commenced on 5th February 2026, inserting a new Schedule A1 into the Privacy and Electronic Communications Regulations.
Paragraph 5 of that Schedule exempts storage or access where "the sole purpose of the storage or access is to enable the person to collect information for statistical purposes about how the service is used with a view to making improvements".
Consent gates your numbers, because a banner suppresses collection until someone agrees. Shopify says so plainly in its own analytics documentation.
That documentation states: when a cookie banner is active in specific regions, data is collected from visitors from those regions only after obtaining consent.
In my own audits this is the step that gets skipped. Anja Beisel reports that for many websites, losing 30 to 50% of user behaviour data occurs when users decline cookies, and 60 to 70% of European visitors reject analytics cookies. Relax that gate and the denominator grows overnight, so the rate above it falls while the shop trades exactly as it did the week before.
Two conditions come attached, so nothing here happens automatically. Exemption requires clear information about the purpose. It also requires that a user is given a simple means of objecting, free of charge, and does not object.
Coverage stops short of every tool you run. Advertising, social-media, personalisation and third-party analytics cookies still require prior consent. Google Analytics is included, because it transmits IP addresses and device identifiers.
Your Shopify analytics and your GA4 can now drift further apart than they did last year, entirely legitimately. Neither one is broken.
Which Metrics To Re-Baseline, And From Which Month
Only the rate-based ecommerce metrics are affected, and only from whichever month your own consent configuration changed. That is rarely 5th February, because most stores changed their banner whenever somebody got round to it.
Anything with sessions or visitors in its denominator needs a fresh baseline, starting with conversion rate and then bounce rate and add-to-cart rate.
Order counts, revenue and average order value are server-side, so year-on-year comparisons there remain safe. Write your changeover month down somewhere your future self will find it.
In eleven months you will be staring at a chart with a step in it and no memory of why.
Which Of These Metrics Belongs On Your Own Dashboard
One Governing Number, Then Three Supporting Metrics
Pick one number that governs, and three that explain its movement. Seven of anything on a screen gets scanned and forgotten by Wednesday.
Start with the one that governs. Talk Shop argues for contribution margin, on the grounds that the north star is the single number that best captures whether the business is compounding, and revenue alone can grow while you lose money.
A north star is the single number best capturing whether a business is compounding, and revenue alone can grow while you lose money.
Contribution margin nets acquisition and fulfilment out of revenue. It falls exactly when growth is bought too expensively, and that is the case every other number hides.
Two measures sit a long way apart here. Reporting on unit economics, The DTC Playbook finds most DTC brands report 60 to 70% gross margin, but after all variable costs the real contribution margin is 15 to 20%. Roughly forty-five points separate what many owners call profitability from what it is.
Direction of travel is worse than the level. ATTN Agency reports median DTC contribution margin fell from roughly 35% in 2021 to about 22% in 2025, driven mostly by rising acquisition costs. Where your own margin thinned over four years while revenue grew, that pattern is industry-wide.
Three supporting metrics explain the governing one. Use conversion rate, average order value and CAC payback.
Where platform attribution has stopped being trustworthy, that same reference notes MER has become the north star metric for DTC brands that have moved past last-click attribution. MER is total revenue divided by total marketing spend.
Daily, Weekly, Quarterly: What Each Cadence Is For
Every one of these ecommerce metrics carries information at some frequency. Look more often and you read noise.
Start with the fastest of those frequencies. Daily is an alarm.
Conversion rate and order volume belong here, watched as a pair. A merchant posting as RKon12 on the Shopify Community forum put the reason plainly: a sudden drop is a signal to go and check site performance.
Reading the two together is also what tells you whether a drop was real, for the reason the previous section gave.
You are watching for a cliff here, and trends belong further down.
Another merchant in that thread posting as Yuparkoti pairs conversion with abandonment as its opposite side. That is a good argument for reading the two together.
Weekly suits AOV, return rate and channel mix, because seven days is long enough for a promotion or a launch to register as signal.
Quarterly suits contribution margin, lifetime value and payback. Anything shorter there is sampling error dressed as a trend, so opening lifetime value on a Tuesday morning is a sign to close it.
Getting A Second Pair Of Eyes On Your Numbers
Where the measurement layer behind your ecommerce metrics is what you cannot trust, an audit has to start there. Every recommendation downstream inherits that error.
Because of that, measurement is the first of the eight disciplines we work through on a Mint SEO ecommerce SEO audit. It comes before a single ranking gets discussed, and getting it right is what makes everything after it provable.
Our Hidden Garden case study records a move from 251 to 24,021 monthly organic visitors, with 2,202 page-one keywords alongside it. We verify the measurement layer before that kind of work starts, because a figure nobody trusts is not worth reporting.
If your admin and your analytics have been telling you different stories, let us settle it before you change anything on the store. Book a free 30-minute consultation with me at mintseo.co.uk/free-consultation.
For the whole picture prioritised in one go, start with a full ecommerce SEO audit instead.

About the author
John Butterworth
John Butterworth is the founder of Mint SEO, a Manchester ecommerce SEO agency he started in 2024. He has 11 years in SEO and digital marketing, previously running SEO departments for market-leading brands and several agencies. He specialises in Shopify and ecommerce SEO, and his work has ranked over 100 websites and driven more than 3 million organic visits. He speaks at industry events including the SEO Mastery Summit.
Connect on LinkedIn →