Knowledge Hub
What A Good Ecommerce Conversion Rate Is (And Why Yours Keeps Moving)
By John Butterworth · August 5, 2026
You have opened Shopify Analytics, seen a figure that looks low, and you want to know whether it is bad. Every ecommerce conversion rate benchmark answers a slightly different question, and not one of them knows where your visits came from.
I am John Butterworth. I run Mint SEO from Manchester, and across 11+ years and 3M+ organic sessions driven for ecommerce stores, I correct how this figure gets read more often than anything else on an audit call.
Below you get the 2026 figures, by industry and by device, with the source and the denominator stated for each one.
After those figures comes the part few benchmark pages publish. Your rate is largely a description of the traffic behind it. It moves when your traffic mix moves, while your store stays exactly as it was.
That distinction decides whether you spend next quarter fixing a checkout that was never broken.
What A Good Ecommerce Conversion Rate Is In 2026
Somewhere between 1.4% and 3% is the honest global answer, and the two ends come from Statista's record of the Salesforce Shopping Index and the IRP Commerce market panel. That spread is not sloppiness, because the panels measure different things.
Global conversion rate figures for 2026
On a visit-based measure the average conversion rate sits at the bottom of that range. Salesforce Research tracks billions of retail visits each quarter, and its Shopping Index figure via Statista has 1.4 percent of visits to ecommerce websites worldwide converting to purchases in Q1 2026.
Narrow the population to UK and EU merchants and the same metric reads differently. Sampling that market monthly, IRP Commerce put its June 2026 reading at 2.03%, against 1.85% a year earlier, which is a rising figure inside a market the global panels record as flat.
Both figures are correct. They count different things, over different merchants, in different months.
Conversion rate formula and its denominator
Orders divided by sessions, times 100. A store taking 200 orders from 10,000 sessions is converting two visits in every hundred.
Your denominator is where comparisons break without anyone noticing. Sessions, visits and unique users produce three different results from identical orders.
An industry benchmark that never names its denominator cannot be compared against yours. Check that first, before you check the number.
Category benchmarks from food to furniture
Your category matters more than the global figure. Benchmarking more than 5 million tracked conversions across 13 industries, Ruler Analytics shows a single headline average hiding wide variation between sectors, with considered purchases sitting far below impulse categories.
Nobody buys a sofa on their first visit. A low rate on a high-value catalogue can be a stronger commercial result than a high one on impulse products, so a good conversion rate is the one your category and your basket size support.
Where Your Rate Sits By Industry And By Device
Device is the split most stores are already losing on, and you can measure it this afternoon.
I have read an ecommerce conversion rate on more store accounts than I can count across 11+ years of doing this, and the 3M+ organic sessions we have driven for clients. Device is the split I check before anything else, because it explains more low readings than any fault on the site.
Desktop and mobile gap
Working from 99 billion web sessions across more than 6,500 websites in nine industries, Contentsquare published the largest device comparison of the year. Its headline finding is blunt, and it holds across nearly every industry the study covers: desktop converts 2.1x better than mobile while mobile accounts for 68% of all visits.
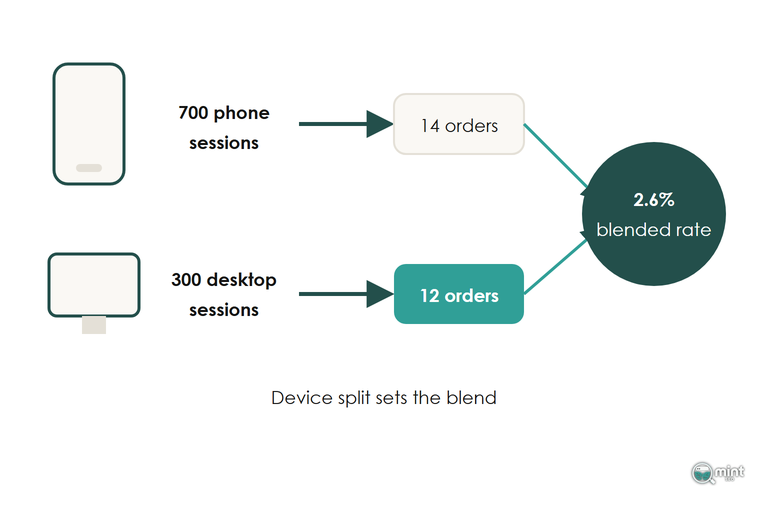
Sit with that arithmetic for a second. Most of your traffic lands on the device that converts at half the rate, so your blended figure gets dragged toward the mobile number by weight of volume alone.
That gap is closing, slowly. The same benchmark put the difference at 2.6x back in 2022. Desktop still wins on transactions per visit.
Volume is not in doubt either. About three-quarters of retail site visits worldwide came from smartphones and generated more than two-thirds of online shopping orders, on Salesforce's 2026 retail analysis.
A measurement problem hides inside the device split too. Webeyez, summarising the same benchmark, records that 73% of ecommerce purchases start on mobile while 58% are completed on desktop.
A session-based rate cannot follow a purchase that begins on a phone and ends on a laptop. It books the browse against mobile and the order against desktop. Mobile is understated at both ends.
Why The Same Store Reports Two Different Rates
Change nothing on your store, change where the visitors come from, and your rate moves. Benchmark tables leave this out.
Writing up the ChatGPT comparison, ALM Corp put the reason plainly. Their point is that non-branded organic sessions, visits from keyword queries that do not include a brand name, represent genuine discovery and consideration traffic.
Threefold spread across traffic sources
Rank your own channels worst to best and the spread is roughly threefold from bottom to top. Working from more than 5 million tracked conversions across 13 industries, Ruler Analytics has paid social at the floor on 0.9% and paid search on 1.5%, with email at 2.4% and organic search at 2.6%. Referral reaches 2.9% and direct tops it at 3.3%.
None of that is a verdict on the channels themselves. Direct and email convert highest because those people already know you, and a per-channel reading is the only way to see it.
Cold paid social converts lowest because it reaches people who have never heard of you. Read those figures as a scorecard and you call paid social broken and email a growth lever. The difference between them is audience.
Neither read survives contact with the traffic underneath it.
What the ChatGPT comparison showed
Cleanest evidence that the source sets the rate came out in February, when Visibility Labs ran a 12-month Google Analytics 4 study across 94 seven- and eight-figure ecommerce brands. As ALM Corp reported, it found ChatGPT referral traffic converting 31% higher than non-branded organic search.
That comparison ran across 9.46 million non-branded organic sessions against 135,000 ChatGPT referral sessions.
Sample size matters here. Across ninety-four merchants, the gap is a property of the traffic itself.
Its exclusions matter too. That study dropped homepage and blog traffic to isolate commercial-intent visits, which lifts every rate it reports and makes it incomparable with a site-wide figure.
The Split Inside Your Organic Traffic That Sets The Number
Organic is not one channel. It is at least two, and they convert nothing like each other.
Brand searches and everything else
Somebody searching your brand name has already decided. Somebody searching a product category has not.
That difference in intent shows up directly in the rate, and the gap is wide enough to swamp anything happening on the site itself. Comparing the two segments directly, Uniek Digital has branded search terms converting at 4% to 8% against 1% to 2% for non-branded terms.
That is a fourfold gap sitting inside the single line labelled "organic" in your reports. Two stores with identical organic session counts can post very different organic rates for no reason other than brand demand.
That brand demand is also the smaller half. Non-branded searches account for the large majority of all organic searches on the same analysis. Your growth therefore sits in the lower-converting half.
Is that gap common knowledge? Apparently not. We put the question to the field on 5th August 2026 by fetching every page then ranking for the search "ecommerce conversion rate", nine from the top of the results and nine buried deeper, eighteen in total.
Each was tested for one thing: which segmentations it offers a reader. Twelve of the eighteen break their benchmark down by traffic source. Four mention branded versus non-branded search at all, and among the nine top-ranked pages that number falls to two.
Segmenting by channel is now standard. Segmenting inside organic is rare, even though it carries the larger per-visit gap of the two.
Why winning non-brand rankings pushes the blended rate down
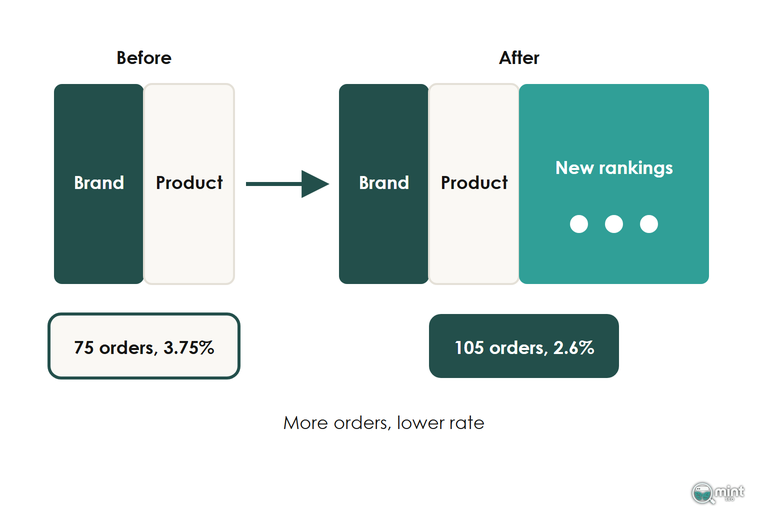
Follow that arithmetic and you reach an uncomfortable result. Non-brand traffic converts several times below brand. Winning a page of new non-brand rankings adds volume at the low-converting end and pulls your blended rate down.
Whenever a client sends me a fallen rate alongside an unchanged store, the explanation is nearly always sitting in the channel report rather than anywhere on the site.
A store winning new non-brand rankings will often see its blended rate drop in the same month its organic revenue climbs. Both movements are the campaign working.
You buy non-brand traffic at a lower rate on purpose. Volume and new customers are what it buys.
That trade is the point of the channel. Despite lower conversion rates, non-branded traffic represents a significant opportunity for acquisition, because the volume offsets the lower per-visit return.
Why Your Rate Moved When Your Store Did Not
Two mechanisms re-sorted ecommerce traffic during 2026. Both change a conversion rate without anybody touching a product page.
How much of a dent are we talking about? Watching real users rather than rankings, Pew Research found users click 8% of the time when an AI summary appears, compared to 15% without.
AI Overviews and the loss of informational clicks
Most reporting on AI Overviews measures lost clicks. For your conversion rate, the interesting question is which clicks get lost.
Agarwal and Sen ran a randomised field experiment on exactly this, stripping AI Overviews in real time for one group over two weeks per participant. As Search Engine Journal reported, AI Overviews cut organic clicks on triggered queries by 38%, and zero-click searches rose from 54% to 72%.
A randomised design separates cause from correlation here. The control group saw normal results, which makes that fall the effect of the feature and not a trend running alongside it.
Those clicks did not move to the ads alongside them. Sponsored clicks and search frequency remained steady, indicating substitution between AI Overviews and organic visits, on the same experiment. Your organic mix absorbs the whole of that shift.
Now the part that touches your rate. Novadata assessed in June 2026 that transactional pages fare better because they are harder for a summary to replace, while guides and explainers are the most exposed.
Read those findings together. The feature strips informational visits faster than transactional ones, leaving organic traffic that is more purchase-ready than before.
Your organic conversion rate then rises while your organic sessions fall. That is a rate improvement you did not earn, and revenue is flat or down while the percentage looks better.
What a core update re-sorts
Core updates do the same job by another route. Google confirmed the May 2026 Core Update on 21st May, framed around rewarding helpful content.
Nobody at Google is adjusting your conversion rate, but a core update reaches it anyway. Amsive describes the process as Google re-evaluating how its ranking systems assess quality signals across the web, and the queries you win or lose in that re-evaluation arrive attached to buyers at different stages.
Change the queries and you change the intent profile of everyone landing. A store that gains rankings on information queries and loses them on product queries watches its rate fall while traffic grows.
Updates land often enough that this is a routine reporting problem. Imaginaire catalogues a Discover-focused core update on 5th February 2026, with the March update following weeks later.
Month-on-month comparisons therefore straddle a re-sort more often than most reporting admits.
How To Read Your Own Number
Split it before you judge it. That is the method, and it takes about twenty minutes.
Splitting your conversion rate by channel
Pull conversion rate by channel for the last 90 days. Split organic again into branded and non-branded using your query data in Google Search Console.
You now have a floor per channel to compare against, in place of one blended figure judged against a global average. Sitting above the platform median tells you nothing about which channel to work on.
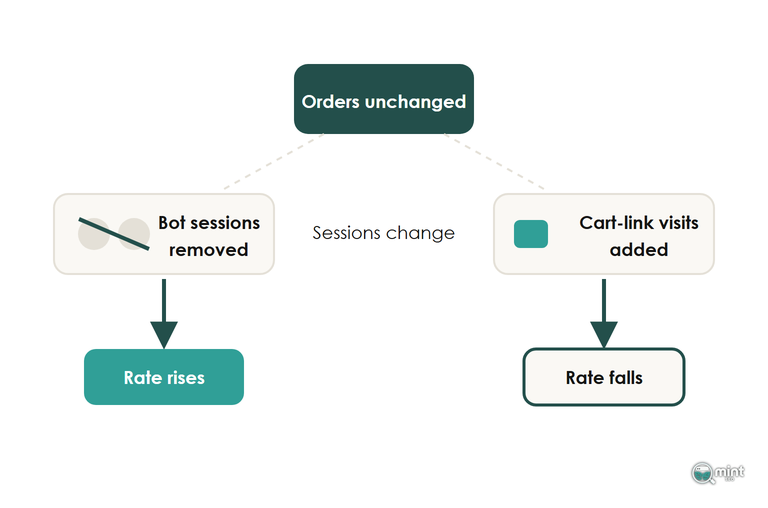
Now compare each channel against itself last quarter. A blended rate that fell while every individual channel held steady is a mix change, and there is nothing on the store to fix.
Why your analytics and your platform disagree
Two tools will give you two rates for the same store in the same week. The gap is normal up to a point.
Comparing the two platforms directly, Blue Frog Analytics records GA4 typically showing 15-30% fewer sessions. Ad blockers and tracking prevention explain most of that, and a smaller denominator against the same orders produces a higher rate.
So their explanation of the direction is the useful part. GA4 reports a higher rate because the users it does track tend to be more engaged, having allowed cookies and not run ad blockers.
So GA4 measures the consenting, non-blocking half of your store. That half converts better than the whole.
Write those thresholds down. Treat a gap under a third as normal, a slightly wider one as worth investigating, and anything beyond that as a tracking fault.
Revenue reconciles far more closely than sessions do, typically within 5-10% on that same comparison. Judge campaigns on money for that reason alone.
Three SEO Changes That Raise Your Conversion Rate
These three move an ecommerce conversion rate through the traffic mix, which is where a search programme does its work.
Win the brand searches that convert hardest
Brand search is the highest-converting organic segment you have, several times above non-brand. Growing brand demand raises your blended organic rate arithmetically.
Make the brand findable at the moment people half-remember you. Claim and complete your brand results page, and keep your name in press coverage and supplier listings.
Check whether marketplaces reselling you outrank your own homepage. Where they do, brand demand is being handed to somebody else.
Match the page the query lands on to what the query wants
A transactional query that lands on a blog post converts badly and always will. Map money queries to collection and product pages, send information queries to content, then check which URL Google is really choosing for each.
Where the wrong page ranks, the fix is usually internal linking and page targeting. If your guide outranks your category page, the guide is eating a transactional query and losing the sale.
Keep the product detail an AI summary cannot reproduce
Guides and explainers are what AI Overviews absorb first. Weight your effort toward pages carrying something a summary cannot reproduce: real product data, stock and delivery specifics, and comparisons only you can run.
Your add-to-cart rate is the early warning here. When it falls on pages that still rank, the visits reaching them have usually changed while the page stayed put.
Checkout and product-page conversion work sits outside what a search programme changes. We have set out how to track conversions properly before changing anything, which is the step most stores skip.
For the fuller diagnosis, read where a store loses the sale.
It is also worth reading which ecommerce metrics are worth reporting alongside the rate, because the rate on its own has never been enough to run a store.
What To Judge Instead
Judge organic revenue per channel, against the same channel last quarter. An ecommerce conversion rate survives nothing of the sort, because a mix change moves it on its own.
Why revenue survives what the rate cannot
That argument picked up a useful data point last month. On 12th July 2026 Full Throttle SEO published The Search Reality Check, analysing analytics data from 18 ecommerce businesses.
It found that AI referral traffic shows promising engagement while organic search still generates substantially more traffic and revenue for most businesses.
That is the whole problem in one finding. AI referral converts better per session, organic delivers more money, and a store optimising for the higher percentage would move budget in precisely the wrong direction.
Organic tends to be under-credited by rate alone. Opensend compiles organic delivering 26.7% of traffic but 31% of revenue. It earns more per visit than its share of sessions suggests.
Revenue also keeps working when demand grows. US ecommerce reached $326.7B in Q1 2026, up 9.75% year on year on the Census Bureau series published through FRED, while blended conversion sat flat.
What that looked like on a real store
A seasonal campaign we ran for BedShelfie shows why revenue is the safer scoreboard. They came to us leaning on paid traffic and seasonal peaks, with product and collection pages ranking below where they should have been.
Over twelve weeks we ran product and collection page optimisation, technical fixes and buyer-intent content built for the peak.
That work returned 256% more sales from Google Search, which is set out in our BedShelfie write-up. Sales from search is the figure we reported against, and it is the one that survives a change in where the traffic comes from.
Orders are also migrating to places your own rate never sees. Social shops held 8% of total orders in Q1 2026 on Salesforce's tracking, and none of those sessions appear in your store analytics.
Where An SEO Audit Fits
Answering the branded versus non-branded question from a standard dashboard is harder than it should be. That single split tells you whether the store got worse or the traffic changed.
The first thing I ask for on a conversion enquiry is the rate split by channel, and organic split by brand. A blended figure cannot tell me whether the store got worse or the mix moved.
It is the first hour of any audit we run, and it usually reframes the brief before we touch a template. Bring me your last two quarters and I will tell you which of the two you are looking at.
You can book a free 30-minute consultation with me and we will read your numbers together.
Common Questions About Ecommerce Conversion Rates
What is a good ecommerce conversion rate in 2026
Somewhere between one and a half and three percent globally, depending whose panel you read and what they divide by. Compare against your own category and channel mix instead. Both move the number more than store quality does.
How do you calculate ecommerce conversion rate
Orders divided by sessions, multiplied by 100. Check which denominator your benchmark uses before comparing against it. Sessions, visits and unique users each produce a different answer from identical orders.
Why is my conversion rate low
Split the rate by channel and by device before assuming the store is at fault. A high share of cold paid social or non-branded organic pulls a blended figure down while every individual channel performs normally.
What is a good mobile ecommerce conversion rate
Expect roughly half your desktop rate. Part of that gap is a measurement artefact, because many mobile browsing sessions finish as desktop purchases.
Does higher traffic lower conversion rate
It can, and that is often a sign the campaign is working. New non-branded rankings add visits at the discovery end of the market, so the blended percentage falls while total orders and revenue rise.