
Knowledge Hub
How To Increase Ecommerce Sales When Ad Clicks Cost More
By John Butterworth · September 27, 2026
Buying another visitor costs more than it did a year ago, which changes the answer to how to increase ecommerce sales. On Meta alone, the cost of reaching a thousand people rose 13.24% across more than 40,000 ecommerce brands between August 2025 and July 2026, according to Triple Whale's Meta ads benchmarks.
The cheapest orders to win are usually from people who are on your store already. After that comes the size of each order, and only then paying for more traffic.
My name is John Butterworth. When a store asks me why sales have stalled, I look at what its current visitors do before I suggest spending a penny on new ones. Our ecommerce SEO services are measured on the orders that follow.
Sell More To The Visitors Already On Your Store
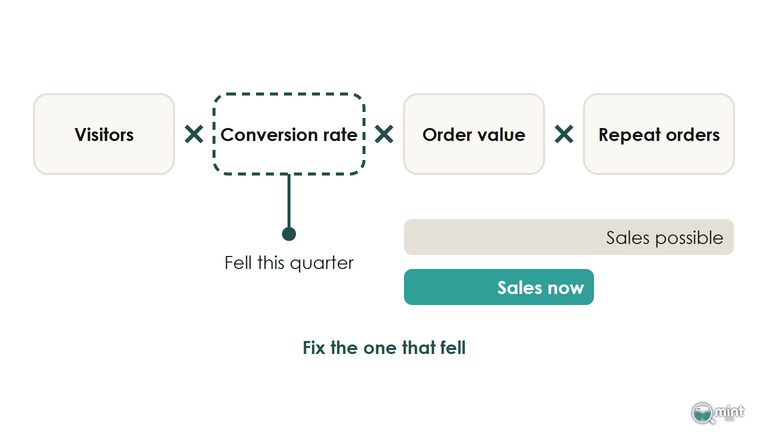
Revenue is sessions times conversion rate times average order value, and repeat buyers add to it each quarter. Any one of the four can fall while the others hold, so pull all four before deciding where the work goes.
- 1. Open Shopify Analytics and pick the last full quarter.
- 2. Compare it with the same quarter a year earlier, which takes the season out of the comparison.
- 3. Put sessions, conversion rate, average order value and returning customer rate side by side.
- 4. Start work on the number that fell furthest.
A fall in sessions is a traffic problem, and I'd fix it with SEO on the collection and product pages before buying clicks. A shopper searching for a linen duvet cover lands on a collection page, and a page that ranks for it keeps sending visits long after an ad budget would've run out.
Assistants such as ChatGPT now send some of those visitors, and Shopify made that route automatic in March 2026: the agentic storefront channel 'will launch by default for your store', as Modern Retail reported.
Your products then appear inside ChatGPT conversations, and the buyer completes the purchase on your own online storefront.
Check the channel is on in your admin. Then read three best sellers as an assistant would: a title that doesn't say what the item is, or a blank size or material, leaves it nothing to match a question to. You'll find the other traffic channels in our guide to getting traffic to a Shopify store.
If the returning customer rate dropped, find the customers who bought once and never came back. Repeat buyers tend to reorder after a predictable number of days, so email the one-time buyers before that many days have passed. Every email after that first one is set out in the post on customer retention in ecommerce.
For most stores I look at, conversion is the number that slipped, and for those stores how to increase ecommerce sales comes down to six changes on the way to and on the product page.
Fix The Site Searches That Return Nothing
Typing into the search box is a shopper naming the product they came for. Give them an empty page and they take that same phrase to Google, where one of your competitors answers it.
Shopify Analytics keeps a report of every search that returned nothing. Read it once a month with one question for each line: do you sell this under another name? Where the answer is yes, a synonym in the Search and Discovery app sends 'throw' to your blankets and the next report comes back shorter.
Filters and result ranking come next, once the empty results are gone, and they're set out in our guide to ecommerce site search.
Hold The Email Pop-Up Until The Shopper Has Seen A Product
An email pop-up that fires the moment a page loads covers most of a phone screen before the shopper has seen the product they tapped through for. A shopper who came for that product often closes the store instead of the pop-up.
Set the pop-up to appear on the second page view or after 30 seconds, keep it off the cart and checkout, and ask for the email address only. You collect a few fewer addresses and keep the visitors who came to look at a product.
Take Each App You No Longer Use Off The Product Page
Every app you install adds scripts that the product page has to load before the buy button works. A slow product page loses orders, and its effect on rankings is real but smaller.
Apps also stay installed long after anyone uses them, with a monthly bill attached.
Go through the apps list in your Shopify admin and uninstall anything nobody on the team can name a job for. These three kinds are the usual culprits:
- an app you trialled and never removed
- an app whose job your theme now does itself
- two apps doing the same job, such as a pair of review widgets
Open Edit code on your theme as well and search the theme.liquid file and the snippets folder for the app's name, because uninstalling doesn't always remove its code. Run a product page through PageSpeed Insights before and after to see the difference.
Get Five Reviews On Every Best Seller
Shoppers can't handle the product, so other buyers' reviews do that job for them, and the first handful on a product does most of the work. In a PowerReviews survey of more than 6,500 consumers, 46% of shoppers said a perfect five-star average makes them suspicious of a product, and 71% consider recency.
Put those two findings together and a product page does best with a rating a little under perfect and a newest review that is only a few weeks old. Leave the honest three-star reviews up, and ask for new ones every month so the newest date keeps moving.
Send a review request by email a few days after the order is delivered, starting with your best sellers, until each has at least five. Reviews also add original text to product pages that otherwise carry the same supplier description as every other stockist, which helps them rank.
Put The Delivery Date Beside The Buy Button
The arrival date is the one thing a shopper can't work out for themselves, and a count of working days makes them do the sum. In a survey of online shoppers, Narvar found that estimated delivery dates sway the purchase for 73% of shoppers, and 40% won't buy when no date is shown.
Shopify can calculate a date range from your fulfilment time and each shipping rate's transit time. You set it up in Settings under Shipping and delivery, in the Estimated delivery dates panel, and the range shows at checkout.
For the product page, open the theme editor, go to the product template and add a text block directly under the buy buttons. Its date has to come from your dispatch cut-off, weekends and bank holidays. If your theme can't calculate that, a delivery-date app can fill the block. Place a test order after the cut-off on a Friday and check the date the page promised, because a missed date costs more than no date at all.
Shoppers delay or avoid a purchase when they aren't sure how long a refund might take, so put your returns window and refund time directly under the date.
Give Shoppers A Reason To Buy From You Today
Shoppers compare prices more carefully than they did, and a visitor with no reason to buy today puts the purchase off, often for good. They need two things from you: a reason to choose your store over the marketplace listing in the next tab, and a reason to act now.
The first is the offer itself. A price that holds up against the market does it, and so do a guarantee or faster dispatch. The second is honest urgency: a real stock level, an order-by time for next-day dispatch or an offer with a genuine end date.
A standing discount code works against both. A shopper who waits a week and finds the same code still running learns that nothing ends, and your margin pays for that lesson on every order.
Every urgency message has to be true, because a countdown that restarts when the page reloads teaches shoppers to ignore the next one. You'll find the honest versions in our post on urgency and scarcity marketing.
Turn More Carts Into Bigger Orders
A shopper who puts something in the cart has already decided to buy from you, so an order lost at the cart is a sale the product page had already won. The cart is also where the size of the order is settled, which makes it the best place on the store to increase ecommerce sales without paying for another visitor.
Show The Full Price Before The Cart
Delivery is usually the last fee a store adds. A buyer who meets it on the final screen feels the price has gone up after they said yes, and the full cart is left behind.
In the Barclays consumer spending report for August 2026, 72% expressed concern about drip pricing, the practice of adding extra fees at checkout. A late delivery charge is exactly that.
So put one line under the price on every product page: what delivery costs, and the spend at which it becomes free. Repeat it in the cart, so the total the shopper sees there is the total they pay.
Set The Free Delivery Threshold From Your Margin
A free delivery threshold works when it sits a little above the basket most of your customers already reach. Pull your average order value from Shopify Analytics and look at where most orders land. Set the threshold one small item above that. Check that the margin on an order at the threshold still pays for the delivery.
Set it far above the usual basket and shoppers ignore it.
Set it below and you give delivery away on orders that would have gone through anyway.
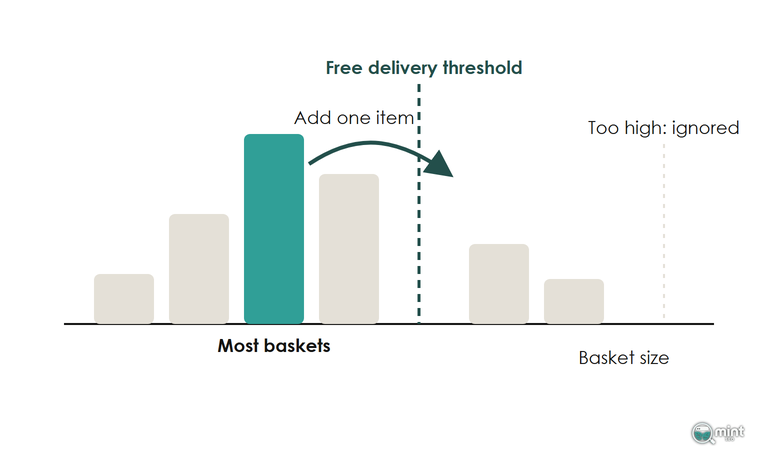
Show the shopper in the cart how much more they need to spend for free delivery, so the buyer who would've paid for delivery adds an item instead. A threshold usually does more for order size than a faster paid option, because it gives the buyer something to add to the cart for.
Offer One Bundle And One Cart Add-On
Look at your orders for the pairs of products customers already buy together and offer that set as one bundle, with the Shopify Bundles app or your theme. Price the bundle as the two products together. The shopper saves the effort of choosing and your margin stays whole.
In the cart, offer one add-on that completes the order: the case for the phone, the refill for the bottle. The Search and Discovery app lets you set complementary products by hand, and our post on where to put an upsell covers the other placements.
Let Buyers Pay Without Creating An Account
On a phone, typing an address and a card number is the slowest part of buying. Express checkout buttons fill both in one tap, and a checkout that asks for an account first adds a form nobody came to fill in.
Turn on Shop Pay and the other express wallets in the Payments settings, and their buttons show on the product page and in the cart. Check your customer account settings too, so checkout never requires a login. Of everything on the list of what you can change in your checkout, those two settings save the shopper the most typing.
Find Out Which Pages Are Costing You Sales
Changes to product pages lift ecommerce sales fastest where those pages already get search visits, and few store owners know which pages those are. Our free audit starts there: give us your website and we will create a free ecommerce SEO audit for your Shopify store.
It pulls your live rankings and the search volumes behind them into a two-page PDF, with your loading speed alongside. You can then see which collection and product pages bring in searchers, and which are too slow to turn them into orders.
There's no call to sit through and nothing to pay. Send us your website for a free SEO audit of your store and it'll arrive the same day.

About the author
John Butterworth
John Butterworth is the founder of Mint SEO, a Manchester ecommerce SEO agency he started in 2024. He has 11 years in SEO and digital marketing, previously running SEO departments for market-leading brands and several agencies. He specialises in Shopify and ecommerce SEO, and his work has ranked over 100 websites and driven more than 3 million organic visits. He speaks at industry events including the SEO Mastery Summit.
Connect on LinkedIn →