
Knowledge Hub
How Your Store’s Funnel Works And How To Fix The Stage That Leaks
By John Butterworth · September 29, 2026
Every sale on your store travels the same route: a visit, something in the cart, an opened checkout and a payment. That route is your ecommerce funnel, and fewer shoppers finish each part than started it.
Shopify already counts every part of it. One report holds your sessions, the visits where something went into the cart, the visits that reached checkout and the ones that paid.
Work out the drop between each pair, find the one that is out of line, and fix that stage first.
I'm John Butterworth, and I've worked on search for online stores for more than a decade. Clients come to my ecommerce SEO agency for more sales from Google, yet a new client's funnel is the first thing I open. With 11+ years in SEO and 3M+ organic sessions driven, I know a visit that stalls at the cart pays nobody, so I find that stall before I send the store more visitors.
Every Sale Follows A Path From First Visit To Repeat Order
A sale on your store passes four steps you can count: the visit, adding to cart, starting checkout and paying. After that comes a fifth, the second order, which decides whether that customer was worth what it cost to win. Those five steps carry the stage names you'll see on funnel diagrams.
Part of the consideration stage now happens before the visit. Shoppers ask ChatGPT or Gemini to compare products, and someone who clicks through from an AI answer has often chosen already, so fewer of them leave between the visit and add to cart.
Read Your Funnel As The Drop From One Stage To The Next
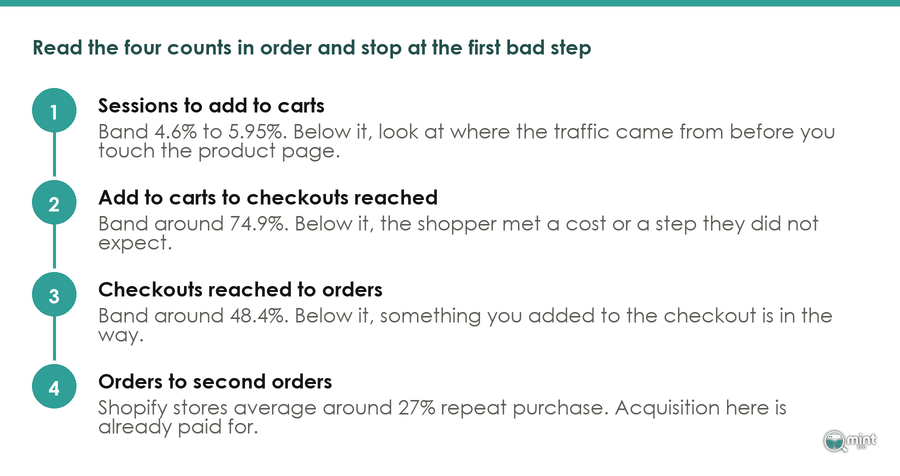
Read your ecommerce funnel as drops: the share of shoppers each funnel stage loses before the next one. The stage losing you sales is the one whose drop is out of line with what that stage normally loses.
Shopify Divides Every Funnel Step By All Sessions
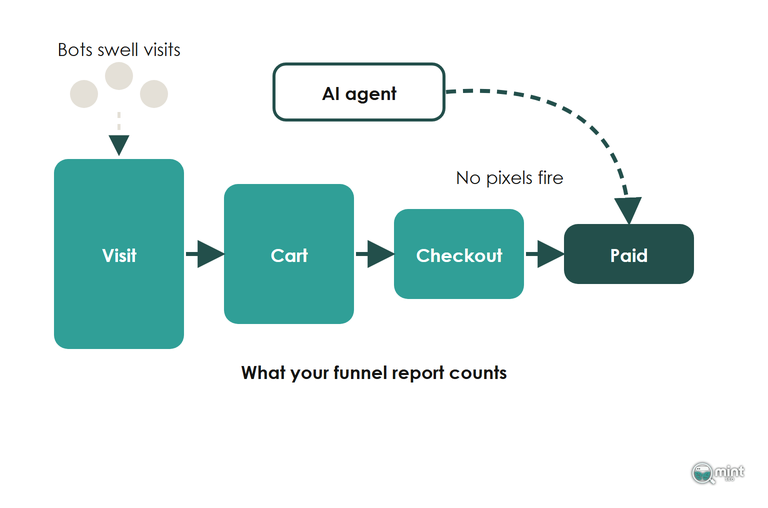
Shopify's conversion rate breakdown report draws your funnel, but every step in it is divided by all sessions. Its reached checkout figure is a share of all visits. On its own it cannot show how many full carts went on to checkout.
Divide each step by the step above it instead.
Set the report to a closed funnel first, so a session only counts at a step if it passed the earlier steps in order. In the open view, a shopper who jumped from a cart link straight to checkout gets counted in steps they skipped.
Next, compare each drop with a benchmark for that step. The one I'd use for the two bottom steps comes from Growth Suite's tracking of 958 Shopify stores in the first half of 2026: in US stores, 47% of shoppers with something in the cart go on to start checkout, and 53% of the ones who start it pay. Out of 100 shoppers who add to cart, that is 47 who start checkout and about 25 who pay.
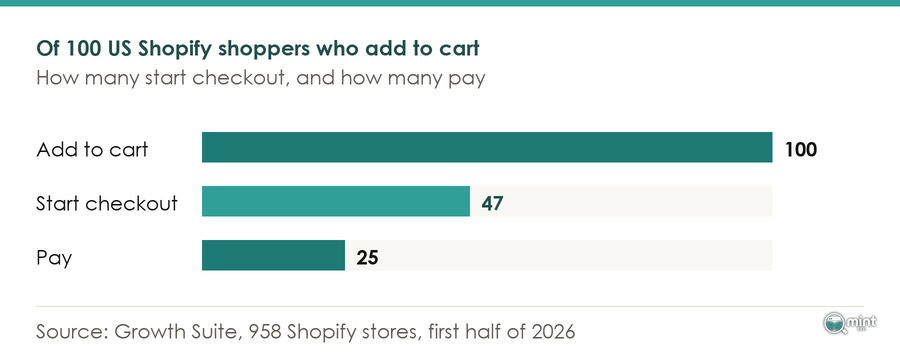
Read your own drops against those rows. If only a small share of your carts start checkout, the cart page is where your sales go missing, whatever the headline conversion rate says.
On a store with a few hundred visits a week, two sales either way can move a rate by a whole point.
Read four weeks together before you decide anything.
Bots And The September 2026 Session Change Move The Top Count
Treat 21st September 2026 as a new baseline for the top drop only, and read the drops below it as before. Every rate in that report sits on the session count, so anything that swells sessions pulls every rate below it down. Bots are the usual cause. A crawler from a country you don't ship to can fill a large share of a month's visits and buy nothing.
That date is when Shopify changed how its analytics counts sessions, sorting bot and system traffic away from real shoppers. Every rate on that page moved with it because each is divided by sessions, from add-to-cart to reached checkout, even on stores where traffic and orders stayed the same.
The drops you work out yourself lower down hardly move, because a bot has to reach the cart before it counts in the cart-to-checkout drop at all.
Compare your visit-to-cart drop only with weeks from after the change. If a drop still looks wrong after that, splitting a step by device and traffic source shows whether one channel is dragging it.
AI Agent Checkouts Put Some Orders Outside Your Funnel
Take the orders that never passed through your storefront out of the count before you judge the bottom of the funnel. Draft orders, point-of-sale sales and subscription renewals have always behaved this way, with no checkout session behind them, and AI agents now add to that pile.
Since Monday 28th September 2026, Shopify has let browser-based AI agents complete checkout on every eligible merchant's site, and some agent purchases never touch your storefront at all. Google Analytics and custom pixels won't fire when a shopper buys through Shopify's direct checkout inside Google AI Mode or Gemini. That sale lands with no visit or cart behind it.
Filter your order list by sales channel, and compare only online store sales with the completed checkout count.
Fix Only The Stage Whose Drop Is Out Of Line
Every stage of an ecommerce funnel loses shoppers for its own reason. Change the stage your reading picked out, leave the others alone until that drop is back in line, and work from the top down.
Win The Buying Searches Now That AI Answers The Questions
For most stores, search supplies a big share of the visits at the top of the funnel. The question searches at the awareness end are sending fewer visits. AI summaries now answer a question like 'what is a sales funnel' on the results page, and fewer of those searchers click through.
That makes buying searches worth more. Someone typing a product name or a category is late in the funnel already. Shoppers who come from an AI answer are in the same state, because they have usually compared products already and land closer to buying.
Commercial pages come before blog content. Put your search effort into collection pages and product pages that rank for those buying searches before you write another guide.
When visits fall on a particular date, check what changed on the site that day first. Only after that, check the date against Google's updates. Google's dashboard dates the May 2026 core update from 21st May to 2nd June 2026, and visits can fall in a window like that with nothing wrong on the store.
A Leak Before The Cart Means The Page Broke The Promise
A large drop from visit to cart usually means the page didn't match what brought the shopper in.
An ad for one product that lands on the homepage makes the shopper hunt for it. A category search sent to a blog post is worse, because the products sit a click further away.
Send each ad and each ranking page to the landing page it promised, with the same product and wording. A shopper who has already chosen a product wants to land on that product's own page.
Visits lasting a few seconds from countries you never targeted are bots or junk traffic, and no page change will convert them.
Most Shopify Carts Die Before Checkout Starts
Most of the carts a Shopify store loses are lost before anyone opens checkout. Go back to the US benchmark above: fewer than half of the shoppers with a cart ever start checkout, so more sales leave at that step than inside checkout itself.
It is also the leak email can't fix. Those shoppers never typed an email address, and no abandoned checkout message can reach someone the store has no address for. Whatever stops them has to be fixed on the cart page.
Show the delivery cost and the full total on the cart page itself, and place express payment buttons beside the checkout button. On a phone, keep that button above any upsells.
Checkout Leaks Close With Express Payment And No Surprise Costs
When a shopper who has already chosen the product leaves at checkout, the causes I find most are no express checkout option, no scarcity or urgency and a weak offer. A surprise cost comes close behind.
Offer wallets such as Shop Pay and Apple Pay at the top of the checkout, so a phone shopper never has to type a card number. Show every cost, delivery included, before the shopper reaches that screen.
Give them a true reason to buy now, such as a delivery cut-off or a real stock level, because a shopper with no deadline puts the order off.
A First-Time Buyer Rarely Comes Back For A Second Order
Count the second order as a funnel stage with its own number, because most first-time buyers never place one. Sender's repeat purchase statistics put the share of an average ecommerce store's customers who come back to buy again at roughly 28.2%.
Fix that drop the way you'd fix any other stage. Send a post-purchase email suggesting the next thing to buy, timed to when the first delivery lands or to when a customer is likely to be running low.
Read Shopify's New vs returning customers report each month as the count for this stage. The wider programme is in the guide to customer retention.
Win The Searches That End In A Sale
If you'd rather hand over the top of your ecommerce funnel, it's the part I work on for clients. Getting collection and product pages ranking for the searches buyers make builds more revenue from organic search, from a channel you own instead of renting it from ads.
An SEO audit sets out which searches each of your pages ranks for and what to fix, in order.
For a quicker start, bring your Shopify conversion rate breakdown to a free 30-minute call with me. We'll put your stage-to-stage drops next to the searches feeding the top of the funnel and pick the first page to change. Book your free consultation and I'll go through it with you.

About the author
John Butterworth
John Butterworth is the founder of Mint SEO, a Manchester ecommerce SEO agency he started in 2024. He has 11 years in SEO and digital marketing, previously running SEO departments for market-leading brands and several agencies. He specialises in Shopify and ecommerce SEO, and his work has ranked over 100 websites and driven more than 3 million organic visits. He speaks at industry events including the SEO Mastery Summit.
Connect on LinkedIn →