
Knowledge Hub
What A Good Conversion Rate Looks Like For Your Store In 2026
By John Butterworth · September 26, 2026
Sell sofas online and three orders from every 200 sessions sits comfortably inside your category's range. Sell coffee and twice that can still leave you behind it.
The published ecommerce conversion rate average is 2.5% to 3.0% of sessions in the August 2026 benchmark from Kissmetrics, yet the categories behind that average convert more than five times apart. That spread tells you the figure to beat is the one for stores in your category, adjusted for how your visitors arrive.
I'm John Butterworth. My ecommerce SEO agency is held to the orders search brings in, so reading a store's conversion figure correctly comes before any fix I suggest.
A Good Rate Depends On Your Category's Band
The average conversion rate for what you sell is the benchmark that matters, because your category sets much of your rate before your product pages do. Someone buying a sofa usually wants to see it in a showroom first, while a coffee buyer reorders the same bag every month without a second look.
These ranges predate the change to Shopify's session count covered further down. Treat each one as a band to sit within, because a Shopify figure from after 21st September 2026 can shift for that reason alone.
Your device mix then moves you within that band. In the same Kissmetrics data, desktop visitors convert at close to twice the mobile rate, so a store whose visits mostly come from phones sits lower for no fault of its own.
Traffic source works the same way. Email visitors buy far more readily than people clicking a social ad, so a month of heavy social spend drags the blended figure down while sales hold.
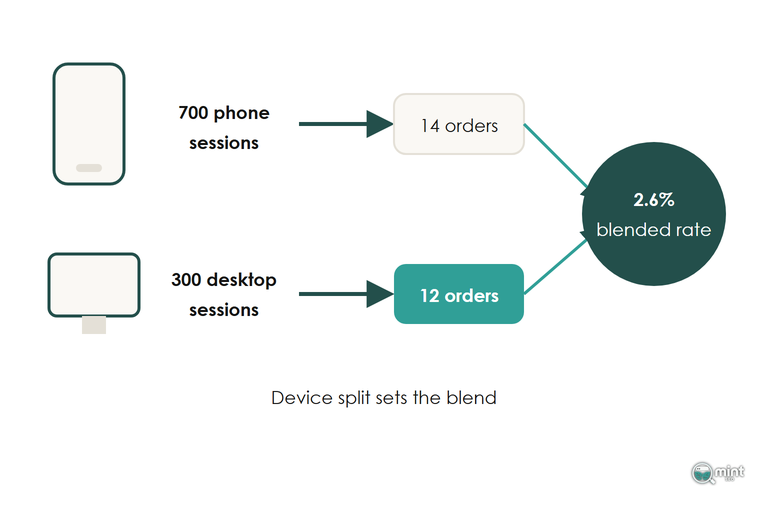
To see how that blended figure forms on your own store, open Shopify Analytics and pull Sessions by device and Sessions by referrer. Say 700 of every 1,000 sessions come from phones and bring 14 orders, while the other 300 come from desktop and bring 12. That is 26 orders from 1,000 sessions, and it is the figure to hold up against your category's band.
Work your own rate out the same way for any period: purchasing sessions divided by all sessions, times 100, with both numbers taken from one tool. Our guide to ecommerce metrics explains why Shopify counts per session.
Holding your rate against the band works best with revenue per session read beside it. If your rate falls while revenue per session holds, each visit is still earning the same money. If both fall in the same weeks, look at the store.
Small stores can skip the benchmark for now. At 100 sessions a month a single extra order moves the rate by a whole point. At that volume the figure reflects luck more than your pages, and getting more of the right visitors comes first.
Why Your Conversion Rate Moves When Nothing On The Store Changed
An ecommerce conversion rate is a share of sessions, so it can rise or fall while every page and price stays the same. Check these causes before you change the store.
New visitors are the simplest cause: first-timers convert less often than returning customers, so a store winning more of them can watch its rate slip while sales grow.
Branded Searches Convert Several Times Better Than Product Searches
In the same Kissmetrics analysis, branded search terms convert at 4% to 8%, several times the rate of non-branded terms. Someone searching your store's name has already chosen you, while someone searching 'linen duvet cover' is still comparing shops.
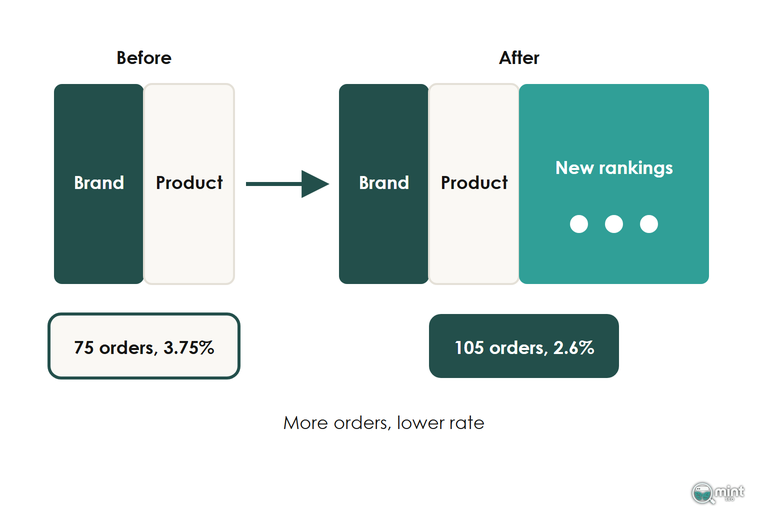
That difference explains a rate that falls while search is working. Picture 1,000 branded sessions bringing 60 orders and 1,000 product searches bringing 15, which is 75 orders from 2,000 sessions. New rankings then add 2,000 more product-search sessions that bring 30 orders between them. You finish on 105 orders from 4,000 sessions: more sales, and a lower rate.
You can split the two in Google Search Console by filtering the queries that contain your brand name, then comparing each group's clicks across the same months. Judge the non-branded side on the revenue it brings in your analytics, because that is where a store's growth from search comes from.
Shopify Recounted Every Store's Sessions In September 2026
If your Shopify rate jumped or dipped in the week of 21st September 2026, check the date before you check the store. Between 21st and 23rd September 2026 Shopify changed how its analytics counts sessions. The Shopify Changelog warned that session-based figures might look different after the update, while orders, sales and customer counts stayed untouched.
Behind that warning, three changes landed together and each moves the figure a different way. A session now lasts as long as the shopper stays active, where it used to end at midnight UTC. A visit running past midnight UTC is now a single session, which trims the session count slightly.
Visits that go straight to checkout from a cart link now count even with no page view, which adds sessions and pulls your rate down.
Identified bots are filtered out by default through Shopify's Human filter, which removes sessions that never buy and pushes your rate up.
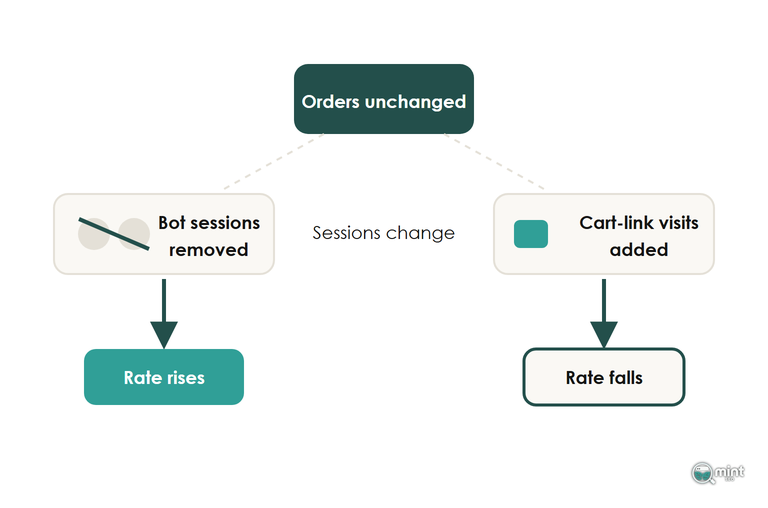
Which way your own figure moved depends on how much bot traffic and cart-link traffic your store had before. Either way, treat the weeks after 21st September 2026 as your new baseline, and keep the Human filter switched on whenever you compare two periods.
AI Assistants Send Buyers Who Arrive Through The Homepage
Visits from ChatGPT now often land on your homepage, a step away from the product the shopper asked about. According to Similarweb, the share of ChatGPT's referrals landing on a homepage rose from roughly 26–29% to about 62–63% by late May 2026. Many AI visits also come with no referrer at all and sit in your direct traffic.
A shopper who lands on the homepage from an assistant has to find the product again, and some of them won't.
If your homepage or direct figure moved while your product pages held steady, check your AI referrals and any jump in direct traffic before redesigning anything.
How assistants choose which stores to mention is covered in our piece on SEO and AEO.
Sessions On Sold-Out Variants Show Up As Bounces
A visit that lands on a sold-out size usually leaves straight away. It reads as an ordinary bounce, yet it still sits in the sessions your rate is divided by.
Before you rewrite a product page, count the sessions that landed on something they couldn't buy. Set Shopify's Sessions by landing page report against your stock levels for the same weeks, and you'll see which products drew visitors while they were out of stock.
If none of these causes explains the move, look at the store itself. Our ecommerce funnel guide shows how to find the step that broke. Once you know it, our guide to improving your conversion rate covers the fixes.
Find Out Which Searches Bring Your Store Its Buyers
Pulling the branded split yourself means exporting Search Console queries, cleaning out variants of your name and matching them to revenue. Our SEO audit starts that work for you: it lists every term your store ranks for and how your search traffic has moved over time.
Retainer clients see their search sales next to their rankings every month, since a position that sells nothing is not the goal. Get your SEO audit, or book a free consultation to talk the split through with me first.

About the author
John Butterworth
John Butterworth is the founder of Mint SEO, a Manchester ecommerce SEO agency he started in 2024. He has 11 years in SEO and digital marketing, previously running SEO departments for market-leading brands and several agencies. He specialises in Shopify and ecommerce SEO, and his work has ranked over 100 websites and driven more than 3 million organic visits. He speaks at industry events including the SEO Mastery Summit.
Connect on LinkedIn →