
Knowledge Hub
Two Ecommerce SEO Case Studies, With the Work, the Timing and the Sales Shown
By John Butterworth · September 29, 2026
BedShelfie sells shelves that clamp onto dorm bunks, and its Google Search sales ran 256% ahead of the previous back-to-college season. Hidden Garden Flowers, a Los Angeles florist, now ranks on page one for searches from people who had never heard of it. This ecommerce SEO case study follows both Mint SEO clients from the starting numbers to the result, and the florist's steepest climb came straight after the December 2025 core update.
I'm John Butterworth, and I manage every retainer at Mint SEO myself, so the calls in both campaigns were mine to make. We're an ecommerce SEO agency in Manchester. Store owners ask me for results like these on a first call, often after paying for SEO that brought visits and no orders.
Before you commit a budget, look at the sequence of the work on each store and the month its numbers started moving, because both carry over to a store selling anything.
Two Store SEO Campaigns And The Order Of Work They Shared
Two stores selling different things to different people made the same three moves in the same order. We fixed the pages each store already had. Hidden Garden's collection headings named nothing a shopper would search for, and BedShelfie's product listings were competing with each other for the same dorm searches.
With that done, every search a buyer makes got one URL built to rank for it. Content, internal links and proof came after, and every piece pointed at those URLs.
You can copy that order on your own store. Collection and product pages earn the revenue, so each one gets its keyword before a blog post is written.
BedShelfie Sold 256% More Through Google In One Dorm Season
BedShelfie sells bedside shelves that clamp onto beds and dorm bunks from its Shopify store. Its year is decided between July and September, when students and their parents buy for the new term.
When we started, a quarter before that rush, the store had no dorm keyword on page one of Google.
When we worked with BedShelfie we built the campaign around that one quarter. Its result in BedShelfie's full write-up compares sales from Google Search across the 12 weeks of dorm season with the same weeks a year earlier. Comparing like-for-like weeks takes the swing between a busy quarter and a quiet one out of the result.
Each Dorm Keyword Got One Page To Rank
Several BedShelfie listings were competing against each other for overlapping searches, so Google had no clear URL to rank for 'dorm bed shelf'. We mapped every transactional keyword from our ecommerce keyword planning to one URL. Dorm terms went to the DormEssential product page, and the homepage took the broad term 'bedside shelf' because it carried the most authority.
With the mapping fixed, we rewrote the title tag and meta description of each URL around its assigned keyword, then the H1 and body copy. We also worked with BedShelfie's team on design changes so the first screen of each listing matched what the searcher had typed.
Three gift guides for students name the BedShelfie first, because a reader who leaves halfway down a long guide never reaches a product mentioned further on.
An internal linking map connected every product page, collection page and blog post with descriptive anchor text. Until then, links between BedShelfie's products came only from Shopify's default related-products block.
BedShelfie's Google Shopping product feed got the same keywords in its titles and a corrected category. That put the right listing in the Shopping tab for the searches those URLs were built for.
The Work Began A Quarter Before Dorm Season
We started in Q2 because a new URL needs time to be indexed and gain authority, while dorm demand turns up on a fixed date. A listing published in August can't rank in time for students buying in September, so starting in Q2 gave BedShelfie roughly three months before the July rush.
If your store has a season, count back from the first week of demand and begin a quarter before it. Seasonal pages have to exist and rank before shoppers start searching, and a store that starts in the month the season opens hands the peak to whoever planned earlier.
All 23 Tracked Keywords Moved Up
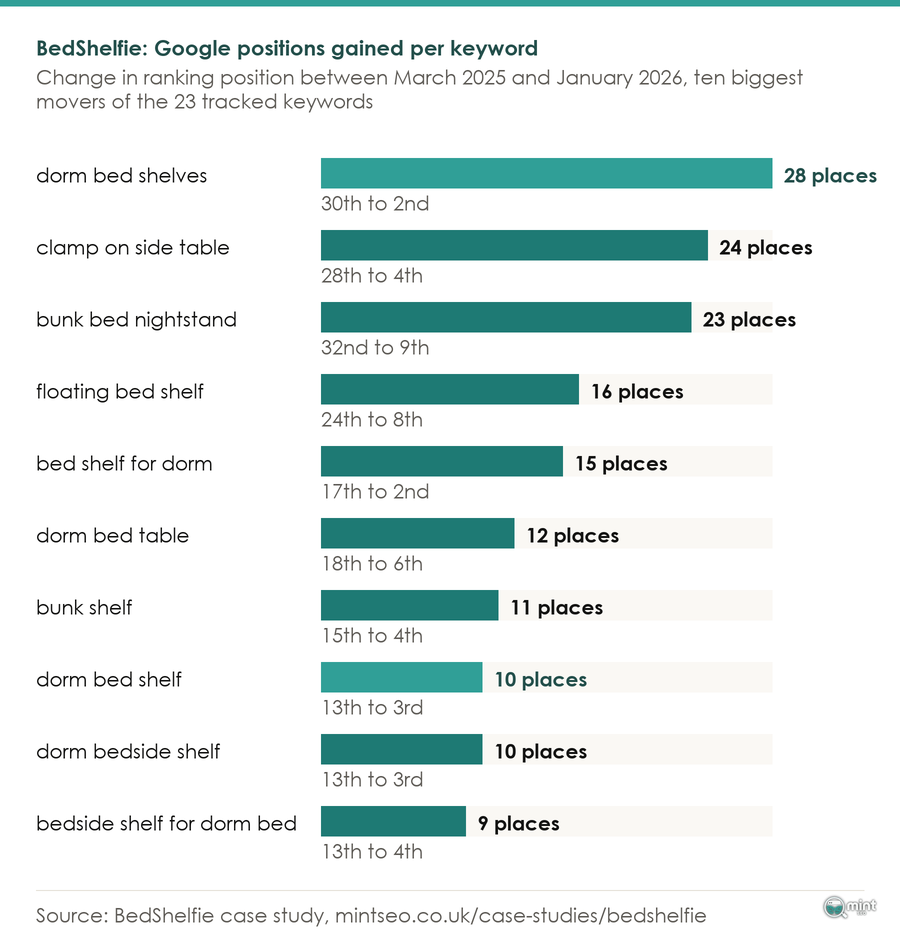
Every one of the 23 keywords we tracked for BedShelfie moved up over the campaign. Here are the ten with the most monthly searches, with positions before and after.
The keywords that moved furthest were mostly the long dorm phrases the DormEssential page was rewritten around, several of them from beyond page two.
We lead with the sales figure because it was checked twice. Shopify's total sales by referrer report and its sales attributed to marketing report showed the same uplift. Shopify separates the referrer that introduced a customer from the one they used immediately before ordering, and both views agreed on the size of the rise across dorm season. BedShelfie's revenue figures are commercially sensitive, so its write-up publishes the percentage.
Hidden Garden Grew Organic Traffic From 251 To 24,021 Monthly Visitors
Our second ecommerce SEO case study is an online store that started almost invisible in organic search. Hidden Garden Flowers sells flowers online for same-day delivery across Los Angeles, and at the start of the campaign 68% of its estimated organic traffic came from people searching its own name. That's a split Search Console's branded queries filter now shows any store and every case study should report.
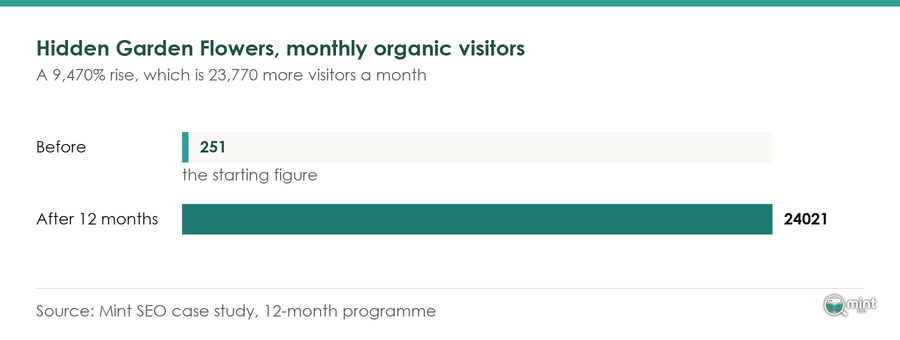
That meant its organic search results came from customers the store already had, and SEO was finding almost nobody new. When we worked with Hidden Garden that changed, and the results in Hidden Garden's full write-up show estimated monthly organic visitors reaching 24,021, with page-one rankings for thousands of searches that don't include its name.
Every Delivery Area Got A Landing Page
Local searches like 'florist los angeles' and 'flower delivery malibu' had nowhere on the online store to land. Its collection pages carried headings like Trending Now that told Google nothing about what they sold. We fixed the existing pages first. Every collection got a keyword heading, we rewrote page titles to lead with the location, and we fixed the crawl issues and duplicate H1s holding those pages back.
After that, each delivery area got a landing page of its own built from one template, such as the Malibu delivery page. Each carried keyword-targeted copy above the fold, the towns covered, same-day delivery details and links on to the collections that sell.
Hidden Garden's homepage took the biggest local term, 'florist los angeles', because it had the strongest backlink profile on the site.
New collections followed for anniversaries, bridal showers and other occasions the site had never covered, then for flower types and colours. We also put the proof a shopper checks onto those pages. The testimonials moved up and the florist's awards went on, and each page says that Hidden Garden delivers with its own couriers.
Our guide to local SEO for an online store covers how to build delivery-area pages that each earn their place.
Traffic Sat Flat Until Two Core Updates Landed
For the first few months after the work, Hidden Garden's traffic line barely moved while Google crawled the fixes and indexed the new pages.
Google's status dashboard shows the June 2025 core update finishing on 17th July, and in Sistrix's analysis the December 2025 core update ran from 11th to 29th December. Hidden Garden's line started climbing in August 2025, the month after the first, and it was vertical by January 2026, straight after the second.
The drawing below shows the shape of that line against the two update windows. It follows the write-up's description and isn't to scale.
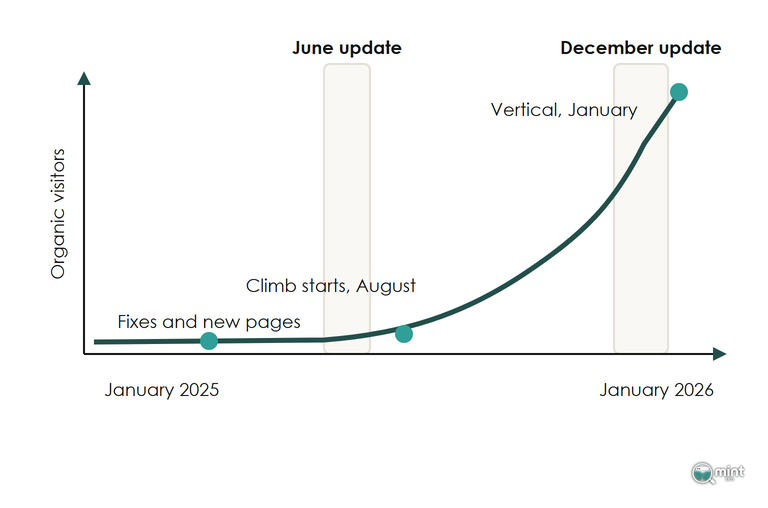
Hidden Garden's delivery-area pages had been live for months when those updates rolled out. The line moved with them, and that timing is what this ecommerce SEO case study shows most clearly. That June update also cut Nordstrom's US organic visibility by more than 29%, according to Sistrix's figures.
That matches what we see across the stores we work on. An improvement often sits unnoticed until the next core update re-scores the site, so I talk to clients about the quick wins first and leave the rest of the timeline open.
If you have SEO work under way, note the date each change went live next to the dates of Google's updates. Some changes register within hours and others take months. When your rankings or organic traffic move, that record tells you whether they moved with an update or with a change you made.
The 24,021 Figure Is An Estimate Built From Rankings
We track Hidden Garden's traffic in Ahrefs, which builds its figure from the keywords a site ranks for, the search volume of each and an assumed click-through rate per position. That makes it useful for comparing the site with itself over time.
Moving from 251 estimated monthly visitors to the figure above shows the size of the change. The estimate includes seasonal flower searches whose real volume swings through the year, so actual visits in any given month sit below it.
New customers show up in the branded share. Of the 2,228 keywords Hidden Garden now ranks for on page one, 16 contain its name. That end figure is a share of keywords, while the starting figure in the section above was a share of estimated traffic, so read the two as a direction of travel and not a like-for-like pair.
For a florist, the 24,021 visitors matter because each one is a possible bouquet order, so the traffic figure is a step on the way to the result. BedShelfie's campaign is counted in Google Search sales, and that's the figure to ask for first on your own store.
You can read the same split for your own store before you judge any SEO result, ours included. Google's guidance for the filter describes searches that include your name as coming from people already familiar with your site, and the rest as a sign of new audience growth. Ask the same of any ecommerce SEO case study you're shown. Ask which figure it is and which dates it covers, and how much of it came from people searching the brand.
What Campaigns Like These Look Like For Your Store
In both campaigns we planned the keyword mapping, technical fixes and new pages together with the content and links that support them. That's how our monthly SEO retainer works, and I plan the work on every account myself.
BedShelfie's listings were competing with each other, so its campaign opened with the keyword mapping. Hidden Garden's collection headings described nothing a shopper searches for, so its campaign opened with those fixes and built the delivery-area pages after. The audit on your store shows which of those two starting points you're closer to, and either way the first months go on the quick wins while organic search catches up.
Those first months sit inside the retainer, which runs month to month after a two-month minimum, and a free consultation is where we talk through the price for your store.
Every campaign starts by finding the buying searches that have no page yet and the pages that cannot rank. To see where your store stands, get a free SEO audit and we'll show you.

About the author
John Butterworth
John Butterworth is the founder of Mint SEO, a Manchester ecommerce SEO agency he started in 2024. He has 11 years in SEO and digital marketing, previously running SEO departments for market-leading brands and several agencies. He specialises in Shopify and ecommerce SEO, and his work has ranked over 100 websites and driven more than 3 million organic visits. He speaks at industry events including the SEO Mastery Summit.
Connect on LinkedIn →