
Knowledge Hub
Your Traffic Decides Which A/B Tests You Can Run
By John Butterworth · August 13, 2026
You have changed three things on your product page this quarter. You cannot say whether any of them helped. A lot of store owners reach ecommerce ab testing from exactly that position, and it is a fair place to start.
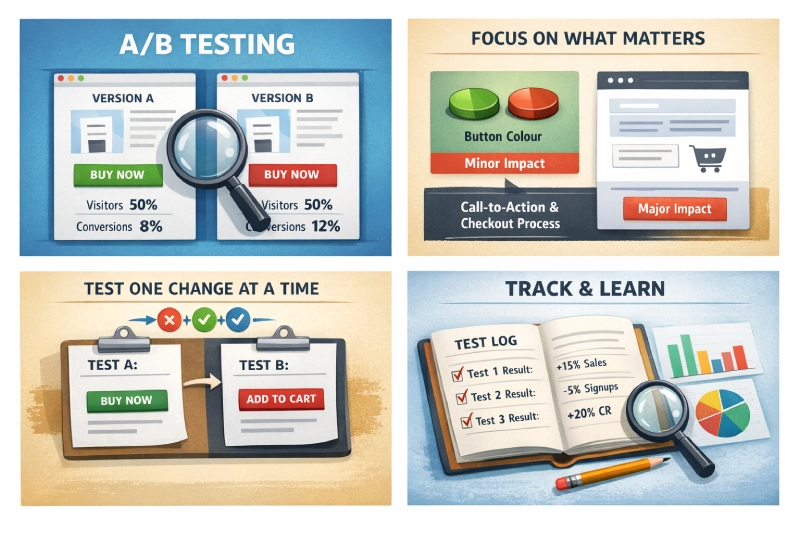
An A/B test splits your visitors into two groups. Each group sees a different version of a page, and you compare what they do. Done properly it settles the question with data.
A separate version of this splits pages and measures clicks from search. That discipline has its own arithmetic. Here we are splitting shoppers and watching whether they buy.
I'm John Butterworth. Over 11+ years in SEO I have driven more than 3M organic sessions, which is the currency this article spends: every experiment on your store is paid for in sessions.
The short answer comes before the reasoning. Test the biggest change you are willing to make, on the template that carries the most sessions, and then measure the step closest to the change you made.
Two numbers govern all of it: how large an effect you are looking for, and how many people will see it.
Start With The Biggest Change On Your Busiest Template
Start with what a test can and cannot see. It tells you something only when the difference it creates is bigger than the ordinary noise in your traffic.
That leaves you two levers. Make the change larger, or put it in front of more people, and every decision about what to test first comes back to one of them.
Vendors say so too, and it is put plainly in Optimizely's guidance for low-traffic sites, which is written for exactly the stores this article is about.
Focusing your tests around areas of your site that visitors consider important can impact conversion rates more than testing small modifications on niche pages.
Why A Button Colour Is The One Test You Cannot Afford
A merchant's first instinct is usually cosmetic. A button colour, a headline tweak, a different shade on the badge. It is a reasonable instinct and it is the worst possible first experiment.
The reason is arithmetic. A colour change moves behaviour by a fraction of a percent, if it moves it at all.
The smaller the effect you are hunting, the more people you need to see it above the ordinary week-to-week noise in your orders.
Halving the effect you are looking for roughly quadruples the audience you need. A cosmetic test therefore spends the most traffic for the least information.
Structural changes behave differently, which is why they belong first. Rewrite what the product page says above the fold, reorder the information, remove a step from the cart.
Those move behaviour enough to show up in the traffic a real store has.
Finding The Template That Carries Your Traffic
Your other lever is where you point the test. You want the template the most sessions pass through, which on almost every store is the product page.
Finding that template takes one report. Open your analytics, group sessions by page template rather than by URL, then rank them by sessions. Whichever template sits at the top is your testing surface for the next quarter.
If you are unsure which step of the journey is losing you the sale, our guide to which step of your store is losing the sale covers the diagnosis first.
Across the ecommerce accounts we run, the most common reason a store cannot act on a test result is that the test was never able to produce one. The change was too small and the template was not the busiest.
Work Out Whether Your Traffic Can Prove The Change
Ten minutes of ecommerce ab testing arithmetic decides whether the next six weeks produce an answer or a shrug. Run it before you build anything.
This is the step of ecommerce ab testing that gets skipped most often, because it is the only one that can tell you not to bother.
The Four Numbers A Sample Size Needs
A sample-size calculation takes four inputs. Two of them describe your store: the baseline conversion rate and the significance level you accept.
Ambition covers the other two: the statistical power and the minimum detectable effect.
Of the four, two are conventions that almost nobody changes. Writing for GuessTheTest, Deborah O'Malley sets out both: a power of 0.80 is standard best practice, and the commonly accepted level for alpha is 0.05.
Her floor for a highly reliable test is a minimum of 30,000 visitors and 3,000 conversions per variant. The conversions half is the one that bites, because a low-converting store can hit a visitor count and still have almost no orders to compare.
Your baseline rate is simply a fact about your store. That leaves the minimum detectable effect as the only input you actively choose.
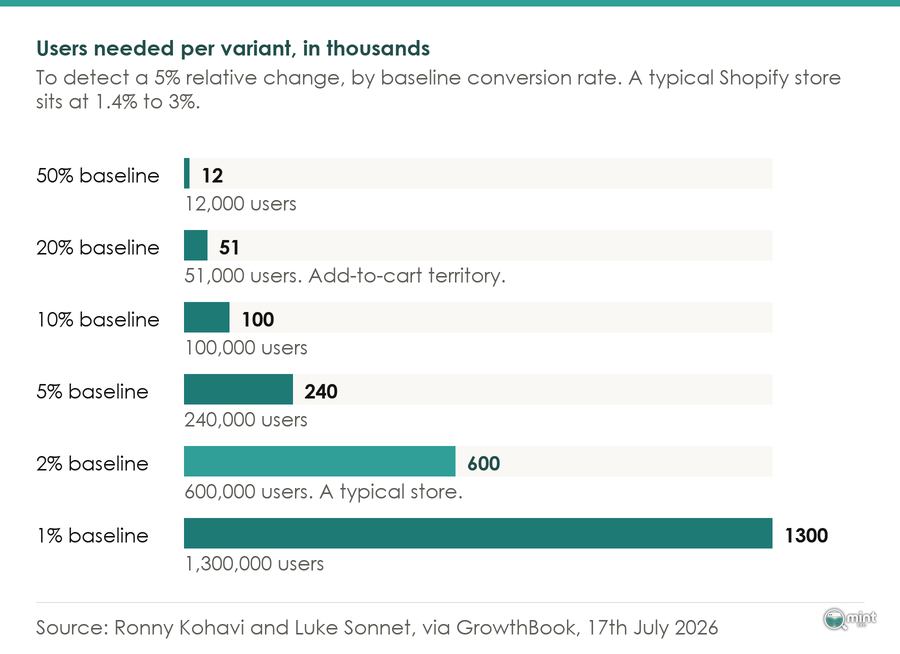
Everybody gets that one wrong. Writing up their work on trustworthy experiments in July 2026, Ronny Kohavi and Luke Sonnet name it as the step where teams underestimate how small real effects are. An optimistic guess there makes an impossible test look affordable. The real numbers are worth seeing.
That answer is easier to read as a table. Their published figures show what the calculation returns for a 5% relative change at each baseline rate, and at a 2% baseline it asks for 600,000 users per variant.
Double that for the two versions and you need 1.2 million sessions through the tested template. For most stores that is more than a year of traffic, spent settling one question.
Source: Ronny Kohavi and Luke Sonnet, via GrowthBook, 17th July 2026. The shape of that table is the part to take away: as your conversion rate falls, the cost of proof accelerates.
What Those Numbers Look Like On A Real Store
Now put your own rate into that table. Across the 2026 Shopify benchmarks, the platform-wide average sits around 1.4% once new and unoptimised stores are counted in, while established stores land somewhere between 2.5% and 3%. That second range is where most readers of this article will find themselves.
Take the middle of that range and the arithmetic bites right away. Most established stores are reading the second-to-last row of that table, some way below the comfortable rows near the top.
Order value pushes it further again. In the same benchmark set, stores selling products under $60 had a median conversion rate of 2.42% regardless of vertical, while stores above $200 had a median of 0.79%. The pattern held across every category the set covered.
That split decides what you are allowed to test. An expensive catalogue pays several times over in traffic to prove the same change.
So a high-ticket store should spend its sessions on structure, while a cheap-basket store can still afford to argue about detail.
Where your rate is the real problem, our guide to ecommerce conversion rate benchmarks is the better place to begin. Fixing a 1% rate beats proving a 1% rate.
That traffic is also getting scarcer, which makes the wait longer. In a randomised field experiment run by researchers at the Indian School of Business and Carnegie Mellon, removing AI Overviews increased outbound clicks from 0.38 to 0.61 per search, and their presence reduced organic clicks by 38% on triggered queries.
Swap Your Success Metric To Add-To-Cart
Everything so far has treated the arithmetic as something to accept. Here is the lever that changes it. Move your success metric to the step immediately after the change.
Candidates are listed in Optimizely's low-traffic guidance. Micro conversions include engagement with the page, clicking Add to Cart or viewing a product detail page.
Each of those happens far more often than a purchase, which raises the baseline rate. Read the table again with that in mind.
That saving is an order of magnitude. Moving from a purchase rate to an add-to-cart rate takes you several rows up that table, which is the difference between a test you will never finish and one you can run this month.
A second half to the same rule follows from it. Measure changes directly on the page with the running experiment rather than measuring final conversions a few pages ahead.
Every step in between adds noise that has nothing to do with what you changed.
If you rewrote the product page, judge it on what happens on the product page. Our write-up of the UX decisions that move a product page covers what is worth changing there.
Why The Lifts You Read About Are Mostly Not Real
A reasonable objection turns up here. If real tests need audiences that large, why does almost every published result promise so much more?
Those two facts are the same fact, because small samples and large reported lifts are produced by the same arithmetic working in opposite directions on the same set of numbers.
What A Real Win Looks Like At Bing And Airbnb
Start with the organisations that run tens of thousands of experiments. They can measure effects nobody else can see, and two things they measure are worth borrowing.
Ronny Kohavi is worth listening to here because he built the measurement systems that produced the figures. He co-wrote the standard textbook on online controlled experiments.
His first useful number is how often experiments fail, and it is worse than anyone expects. In the workshop write-up with Luke Sonnet, the reported success rates are Bing at 15%, Airbnb Search at 8%, and Booking, Google Ads, Netflix and Optimizely all around 10%.
Set that against the double-digit wins in circulation and you have the whole problem in one line.
How A 364% Lift Happens
Underpowered tests fail loudly. The spectacular numbers they produce are why so many published results look nothing like the ones above.
In her analysis of oversized results, Deborah O'Malley documents a test reporting a +364% lift that ran on 17 visitors against 11. Another test in the same collection reported a +337% lift on a sample of 82 visitors against 75, which is the kind of headline figure that gets screenshotted and passed around.
Why that happens is simple enough. With a handful of conversions in each group one extra order swings the percentage wildly, and the significance test offers no protection because it was never designed for a sample that size.
Neither result means anything, though both cleared the significance threshold. At that sample an underpowered test does not merely exaggerate the effect. It can report the wrong direction entirely.
Kohavi's rule of thumb for reading any result is what I would take from this whole section. Any figure that looks interesting or different is usually wrong. Treat a startling number as a reason to check your instrumentation.
How To Run The Test So The Answer Holds Up
Three decisions decide whether your result survives contact with reality, and all three are taken before the test goes live, never while it runs.
They sit inside a sequence, so here is the whole thing in order, from choosing the change through to reading the result.
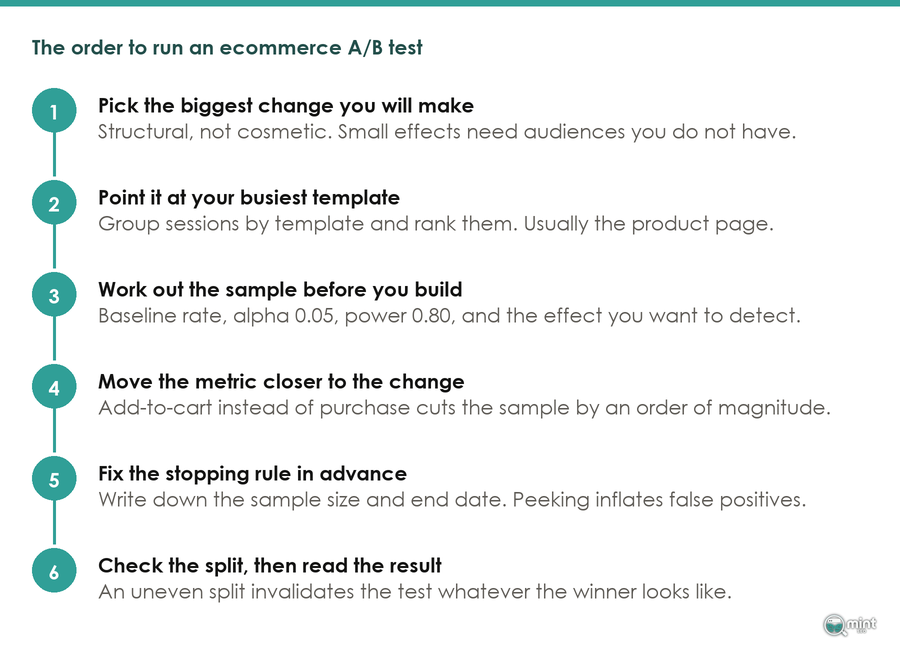
Skip those three and ecommerce ab testing becomes guesswork with a dashboard attached.
Decide The Stopping Rule Before You Start
Write down the sample size and the end date, then leave it alone. The founder of Analytics Toolkit, Georgi Georgiev, explains what watching does to a result.
Data peeking or data-driven optional stopping leads to results where the classical significance test offers no error guarantees if misused. What you get instead are illusory findings.
That cause is mechanical. A significance test assumes one look at a pre-set sample.
Check daily and stop the moment it reads significant, and you have taken twenty chances for random variation to cross the line.
Worse, the base rate is against you from the start. An alpha of 0.05 accepts a one-in-twenty chance of a false positive by definition, so a stream of tests will throw up winners that were never real.
Where you must look early, design for it up front. There is a sequential approach from Georgiev that spreads the error budget across looks planned in advance. Run weekly analyses at a 0.05 threshold and that error spreads across all of them, holding the overall false positive rate at no more than 5%.
Check The Split Before You Read The Result
Look at how many people landed in each group before you look at who won. If you asked for an even split and one side came back several points ahead on visitor count, something upstream is filtering one group differently from the other.
Its name is sample ratio mismatch. It is common enough that the serious experimentation platforms run an automatic check for it, and common enough that Kohavi treats it as a standard validity test rather than an edge case.
Kohavi's summary of the whole problem is worth pinning above the desk. Getting numbers is easy, getting numbers you can trust is hard.
Run Whole Weeks, And Stop At Eight
Run for whole weeks. Shopping behaviour varies by day, so an ecommerce ab testing run cut on a Wednesday over-weights whichever days it happened to catch.
O'Malley's rule is a minimum of two weeks but no longer than six to eight weeks. Two weeks covers two full weekly cycles. Past about eight your test has outlived the conditions it started in, because prices and campaigns and stock have all moved underneath it.
Seasonal trading makes all of that harder, which is why our Black Friday planning guide puts the experiment work well before the season starts.
Keep to two variants while your traffic is modest. The guidance for low-traffic sites is to limit the number of variants tested, usually to 2, so each version receives enough traffic to draw conclusive results.
That arithmetic matches everything else here. A third version does not add a third to the cost. It takes a third of the traffic away from each of the others.
Running The Test On A Shopify Store
Testing mechanics on Shopify changed this year, and a lot of the advice in circulation predates the change. Testing on Shopify used to mean installing an app and accepting the script that came with it.
What Rollouts Covers, And Which Plan You Need
That stopped being true in June. On 5th June 2026 Shopify's changelog announced it: schedule, publish, and A/B test new themes and checkout and customer account configurations. The feature is called Rollouts and it sits in the admin under Markets.
It covers three jobs. You can schedule an entire new checkout or theme for a date and time. You can roll one out gradually to a percentage of visitors, or run a straight A/B test between two setups.
It also handles the housekeeping that used to break hand-rolled tests. A copy of your published theme or config is created automatically. You can keep working on your live store while a test runs.
There is no app to install, no third-party script and no extra subscription.
Two caveats come with it. Shopify's own requirements page is explicit about the plan gating: rollouts are available on the Basic plan or higher, while experiments are available to stores on the Grow plan or higher.
Rollouts is also theme-level, which rules out a good deal. Shopify's requirements page states that you cannot change Liquid templates as part of a rollout, and that headless and custom storefront checkouts are not supported.
Pricing sits outside it as well. In an early assessment for the agency Conspire Daniel Andrade records that Rollouts covers theme-level changes and cannot test product pricing or discount structures.
He also notes that the built-in reporting carries no confidence intervals.
What it does cover happens to be what a low-traffic store should be testing anyway. The theme is where the hero section, the page layout, the navigation and the collection grids live.
Those are structural changes, which is the first lever from the top of this article.
Testing Product Imagery Without Breaking Your Product Data
Imagery is the common request Rollouts cannot reach, because images belong to the product record and never to the theme. Merchants go looking for an app that tests whole image sets and generally do not find one.
So merchants fall back on the duplicate product method. To test entire image sets on the product detail page you create a duplicate of the product. Upload your new set of images to it, then split traffic 50/50 between the two handles.
It works. What nobody warns you about is the cost: two URLs, two sets of inventory and two candidates for your product feed. All of it has to be reconciled when the test ends.
Avoid rolling your own split in theme code, whatever else you do. A hand-written random number will not persist throughout the customer journey between pages.
A visitor can then see one version on the collection page and the other on the product page. Somebody who sees both belongs to neither group.
Why You Cannot Split-Test Price On A Fed Product
Price is the test merchants most want to run, and the one route that is closed. Where a product appears in a Google Shopping feed, showing two prices to two groups of visitors breaks Google's product data policy.
Read the policy wording and it leaves no room for interpretation.
Do not change the price of your product on your landing page based on a user's location.
It goes on to rule out changing price by cookie, browser or device. That last clause is precisely how a split test works.
Consequences are not limited to a warning either. Price mismatch triggers preemptive item disapproval, and once you have fixed it a review takes seven business days to complete.
Two compliant alternatives exist and you should know they are weaker. You can price differently by market through separate feeds. You can run a sequential test, comparing a few weeks at one price against a few weeks at another.
A sequential read carries every seasonal and campaign effect that a split test exists to remove, so treat it as a signal, never a verdict. Where pricing is the lever you keep returning to, the wider CRO picture is worth reading first.
Where A Free Consultation With Mint SEO Fits
Everything above is arithmetic you can run yourself. What it cannot do is tell you which of your own templates carries enough sessions to be worth testing.
That depends on your catalogue and your navigation and where your traffic lands. It is the first thing I look at on a store.
A free 30-minute consultation is a call directly with me, working from your own analytics. I will point out which of your templates could carry a test next quarter and which could not.
You get straight answers and a rough 90-day direction, plus time for whatever you want to ask. Most of that half hour goes on the one question this article cannot answer for you, which is whether your own numbers clear the bar.
Where your busiest template cannot clear the numbers above, growing the traffic comes first, and that is what makes ecommerce ab testing possible at all. So book a free consultation with John and we will work out which of the two you face.
Two other reads sit either side of this one. Start with customer retention for what happens after a test wins. Choosing a platform you will not outgrow comes before both.

About the author
John Butterworth
John Butterworth is the founder of Mint SEO, a Manchester ecommerce SEO agency he started in 2024. He has 11 years in SEO and digital marketing, previously running SEO departments for market-leading brands and several agencies. He specialises in Shopify and ecommerce SEO, and his work has ranked over 100 websites and driven more than 3 million organic visits. He speaks at industry events including the SEO Mastery Summit.
Connect on LinkedIn →